
Figure 9.
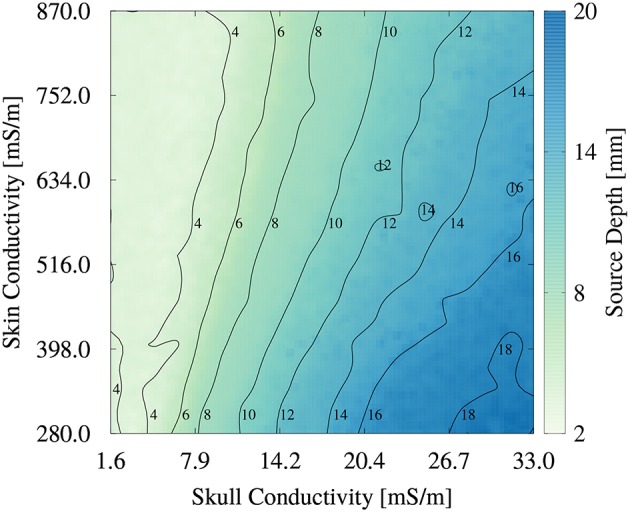
Image plot of source depth as a function of skin and skull conductivities for the multivariate distribution. Contours mark isolines of the source depth.
Official websites use .gov
A
.gov website belongs to an official
government organization in the United States.
Secure .gov websites use HTTPS
A lock (
) or https:// means you've safely
connected to the .gov website. Share sensitive
information only on official, secure websites.
Image plot of source depth as a function of skin and skull conductivities for the multivariate distribution. Contours mark isolines of the source depth.