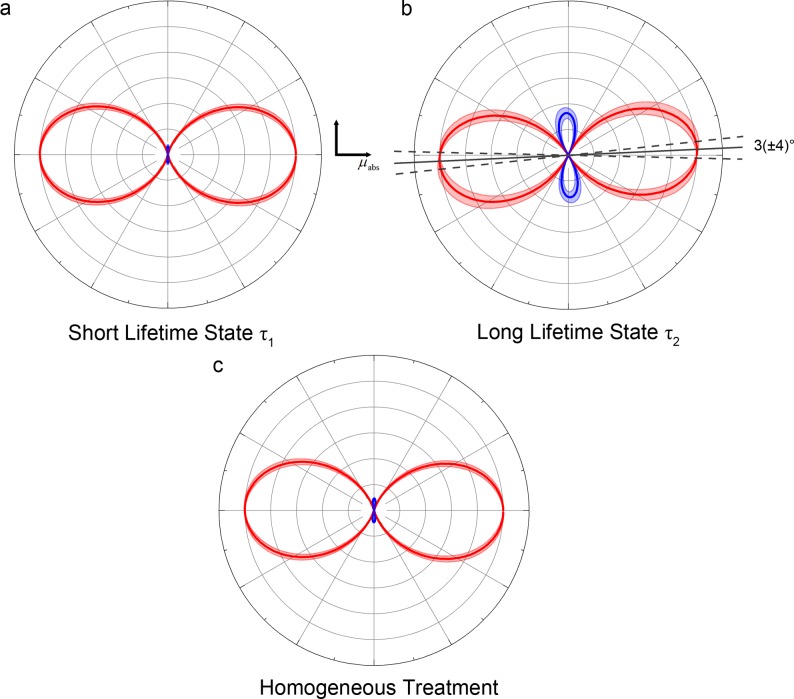
Figure 6.
2PA tensor polar plots for the combined NADH and NADPH data displayed in Table 3. The distance of the line to the origin dictates the transition amplitude at each angle. Red and blue lines indicate positive and negative amplitudes, respectively. Shaded areas represent uncertainty bounds. While the short lifetime tensor is dominated by a single element (a), the long lifetime species exhibits negative lobes which rotate the direction of maximum absorption by around 3° from the single-photon S0–S1 transition (b). These features could not be resolved if the excited state population was treated as homogeneous (c).

