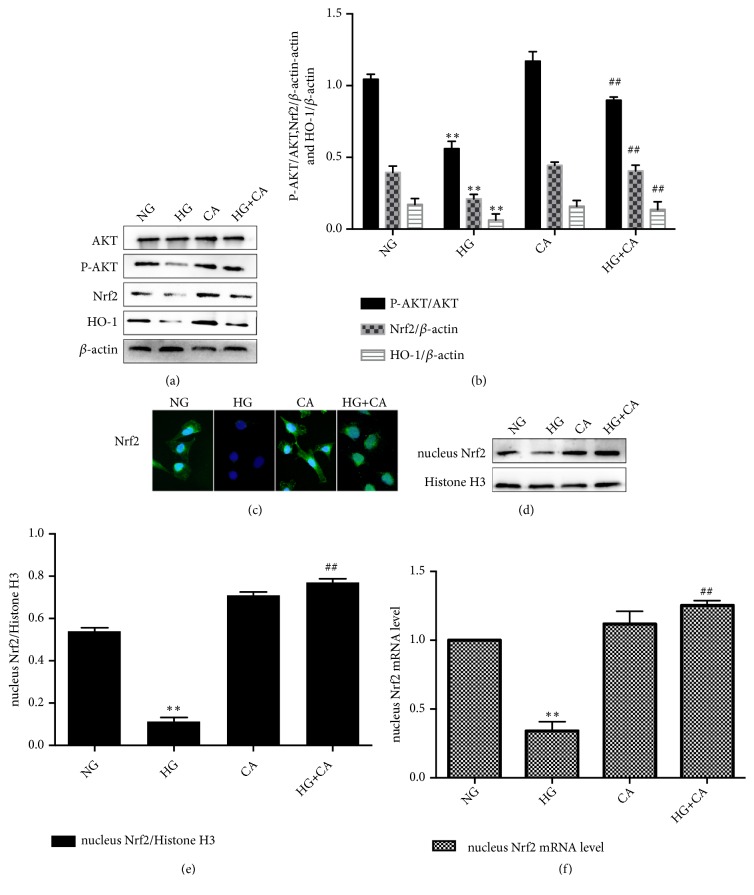
Figure 3.
Effects of carnosine on PI3K/AKT and Nrf2 pathways in MPC5 cells. (a-b) The protein expression levels of AKT, P-AKT, Nrf2, and HO-1 were detected by Western blot (n=3). (c) The effects of carnosine on the expression of Nrf2 in MPC5 cells were detected by immunofluorescence (n=3). (d-f) The protein expression of Nrf2 in nucleus was detected by Western blot (n=3); the mRNA expression of Nrf2 in nucleus was analyzed by RT-qPCR (n=3). NG: normal glucose 5.5mM; HG: high glucose 30mM; CA: carnosine 20mM; HG+CA: high glucose (30mM) plus carnosine (20mM). Data are presented as mean ± SD. ∗P < 0.05, ∗∗P < 0.01 vs. NG, #P < 0.05, ##P < 0.01 vs. HG.

