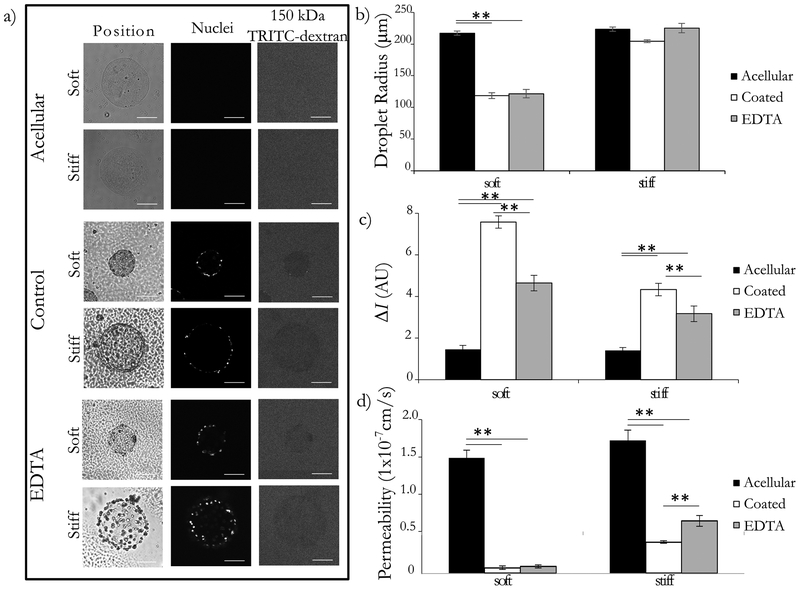
Figure 4: Microtissue endothelial barrier function is comparable to in vivo permeability.
Endothelial cells were cultured on the surface of soft and stiff collagen microtissues for 5 days. Tissues were collected and some were treated with 5mM EDTA for 30 minutes. Constructs were placed in a 12.5 ug/mL dye bath and incubated for 20 minutes. (a) Constructs were imaged with brightfield and optical sectioning. Brightfield imaging shows the location and geometry of the microtissues, nucelear stain confirms the presence of ceslls, and the movement 150kDa TRITC-Dextran was visualized with flourescence microscopy. We qualitatively observe that acellular constructs do not impede dye movement, whereas the control condition showed exclusion of the dye from the interior of the microtissue for both the soft and stiff conditions. The EDTA treated condition appeared to have an intermediated phenotype. Backround noise was reduced in representative images for clarity. (b) We report the average droplet radius with standard error, showing that the soft constructs were compacted significantly, and the stiff constructs were largely unchanged in diameter. (c) Comparing the intensity inside and outside the droplet (ΔI), we found that ΔI was small for acellular constructs, and largest for coated constructs for both soft and stiff microtissues. We found that the removal of the cell layer resulted in an intermediate ΔI for both stiffnesses. (d) Converting the ΔI to the permeability using Eq. (3), we found the acellular constructs to have the largest permeability, and the coated controls to have a permeability that was statistically significantly smaller for both cases. For the EDTA treated group, we found that this increased the average permeability for the stiff constructs in a statistically significant manner. There was a slight increase in the average also for the soft constructs, but this difference was not statistically significant. We used these permeability values to calculate the contribution of the ECM and the cell layers individually and found the permeability of the cell layer to be on the order of 1×10⁻⁸ cm/s. assay. All comparisons completed with one-way ANOVA with post-hoc Tukey HSD test; p<0.01 = **. Scale bars 100 μm.

