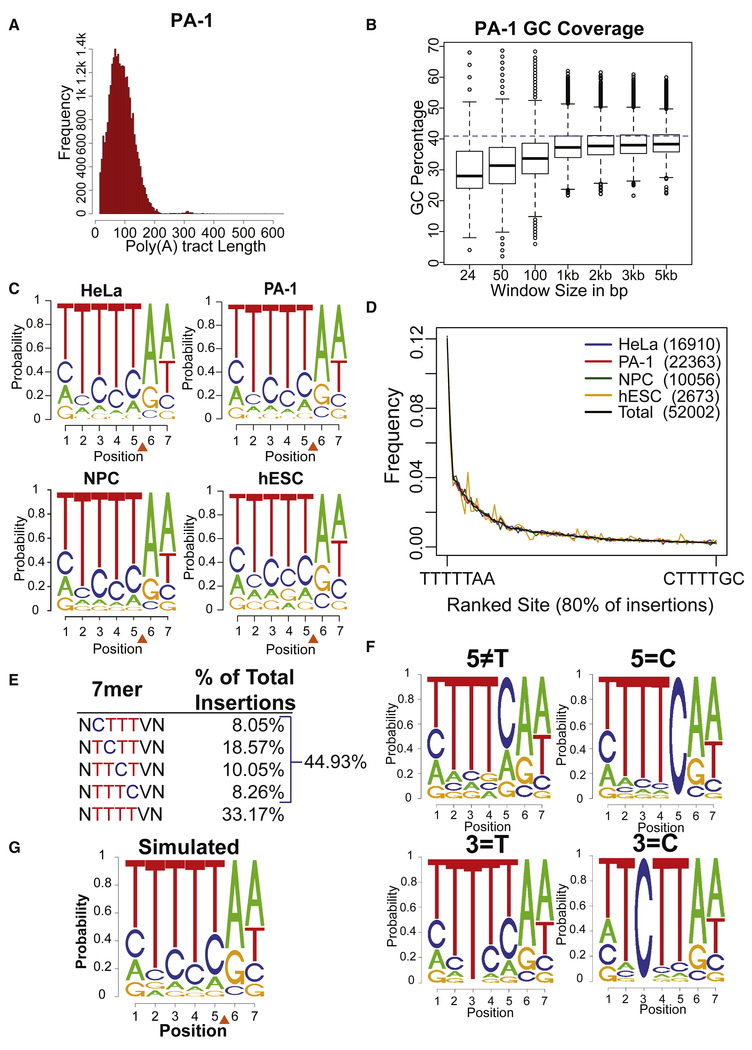
Figure 2: Local L1 integration site preferences.
(A) Frequency distribution of the poly(A) tract lengths of L1 insertions in PA-1 cells.
(B) GC content of different sized windows of genomic sequence surrounding L1 insertion positions. A blue dashed line represents the genome average of 41%. Similar results were observed for all cell lines.
(C) Logo plots of the 7bp degenerate L1 EN consensus sequence for insertions from four cell types. The orange triangle indicates the L1 EN cleavage position.
(D) Frequency distribution of L1 7mer integration site sequences. Plotted sites correspond to 80% of all observed insertions arranged in rank order frequency over all cell lines.
(E) Percentage of L1 insertions that utilized 7mers with T bases, or 3 T bases plus 1 C base, at site positions 2 through 5. N, any nucleotide; V, any nucleotide except T, which cannot be present at position 6 (see text).
(F) Logo plots of subsets of observed L1 integration sites where different nucleotide positions were constrained as indicated above each plot to illustrate the co-dependence of positions 2 through 5.
(G) Logo plot of 7bp L1 EN cleavage ses from one iteration of our weighted random simulation.

