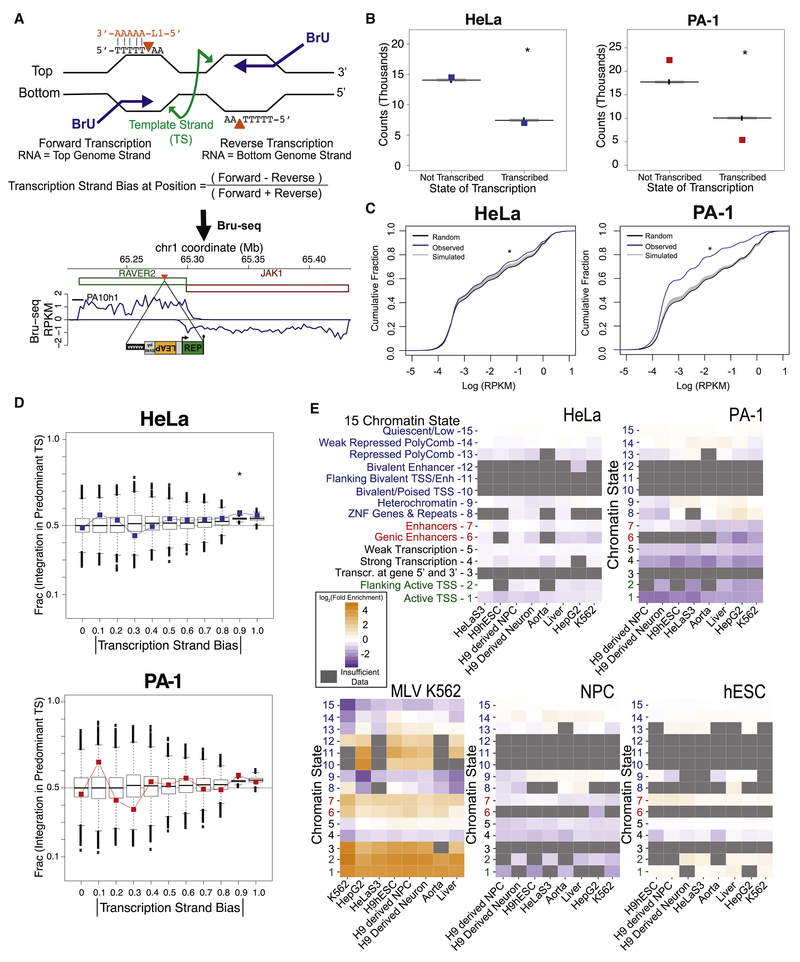
Figure 4: L1 does not preferentially target transcribed regions or open chromatin.
(A) Possible cleavage by L1 EN (orange triangles) on non-template (i.e. coding) DNA strands during transcription initiates TPRT as the L1 RNA (orange) anneals to the poly(T) stretch. Example PA-1 Bru-seq data below surround an actual L1 insertion in the antisense orientation of the RAVER2 gene. Green and red rectangles, genes with forward and reverse orientations, respectively. Bru-seq signal, blue line, plotted as positive and negative RPKM for transcription in the forward and reverse directions, respectively.
(B) L1 events stratified by transcription of their insertion positions. Observed insertion counts are plotted as colored symbols; boxplots show distributions from 10,000 simulation iterations. HeLa-JVM and PA-1 χ2 test: p= 6.2× 10⁻⁶ and p< 2.2 × 10⁻¹⁶, respectively.
(C) Cumulative distribution functions (CDFs) of Bru-seq transcription for random genomic L1 insertions (black), 10,000 simulated insertion iterations (gray), and actual L1 insertions (blue). Both HeLa-JVM and PA-1 contained more insertions than expected at lower transcription levels (KSbt p< 1 × 10⁻⁶).
(D) Absolute values of transcription strand bias [see panel (A)] were separated into intervals from 0 to 1 (x-axis). The plotted fraction of insertions in genomic regions matching each interval that arose by integration of the L1 (+) strand cDNA into the template strand (TS) (y-axis). Cell line data plotted as colored squares; boxplots depict 10,000 simulation iterations. Asterisk indicates χ2 test p< 0.05. See text for interpretation.
(E) Insertion sample sets were compared to Roadmap Epigenomics Consortium chromatin state data (y-axes) derived from a series of cell lines (x-axes). The most relevant cell type is leftmost on the x-axis. States are grouped as: enhancers (red), promoters (green), transcribed regions (black), and heterochromatin (blue). Box colors represent the log2 fold enrichment of the insertions relative to the set of genomic regions defined by each chromatin state/cell type combination. Gray boxes mask states with <30 expected insertions. MLV integration events from the K562 cell line (LaFave et al., 2014), down-sampled to the same number of events as observed in our PA-1 insertions, illustrate the appearance of a transposable element with a strong state enrichment.

