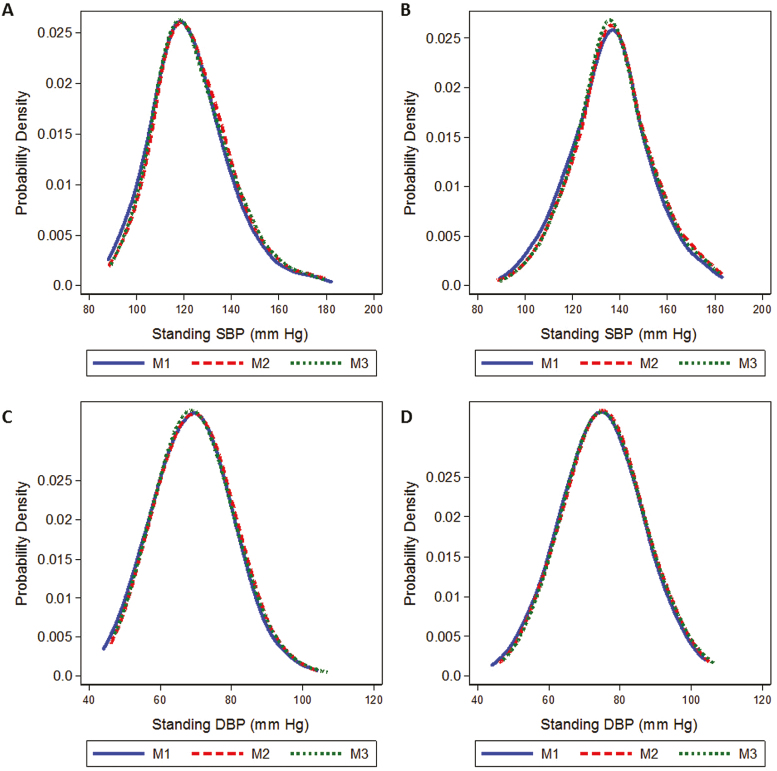
Figure 1.
Kernel density plots of the distribution of standing systolic blood pressure (SBP) for intensive (a) and standard (b) blood pressure treatment goals, and diastolic blood pressure (DBP) for intensive (c) and standard (d) blood pressure treatment goals. Each line represents measurement 1–3 (M1 solid, M2 dash, M3 dot). There were 2,110 participants assigned the intensive BP goal, and 2,145 participants assigned the standard goal, contributing 7,153 follow-up visits. M1, standing measurement 1; M2, standing measurement 2; M3, standing measurement 3.

