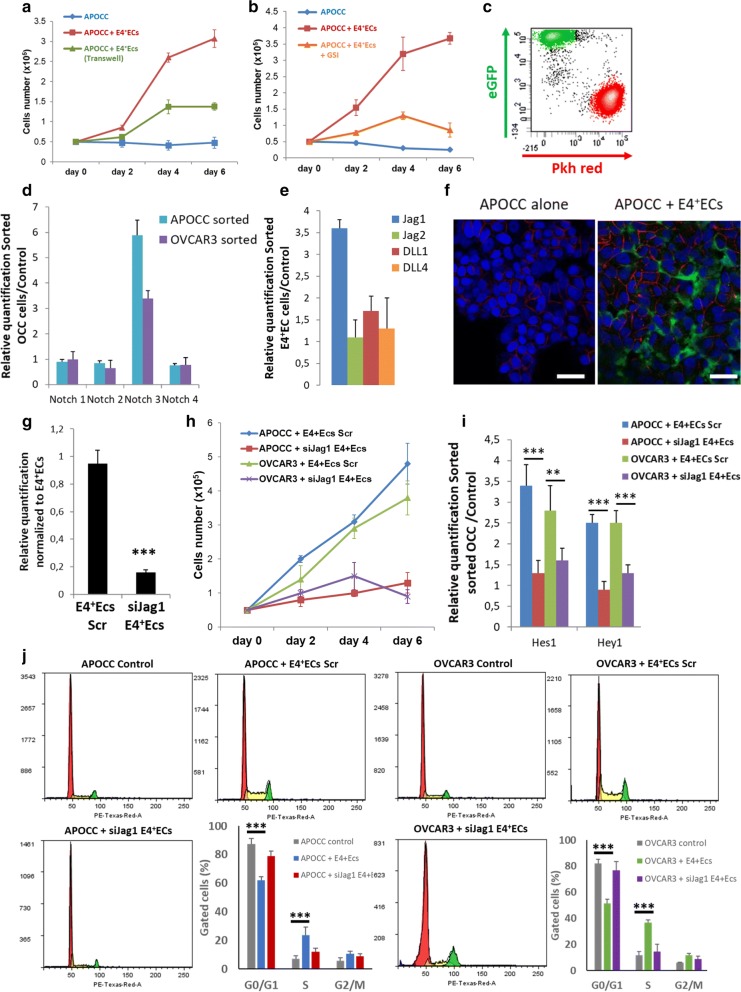
Fig. 2.
a Proliferation assay. APOCC were plated and counted every 2 days: alone, in coculture with E4+ECs or in presence of E4+ECs via transwell for 6 days. b Proliferation assay. APOCC were plated and counted every 2 days: alone, in coculture with E4+ECs or in coculture with E4+ECs with or without GSI for 6 days. c Flow cytometry cell sorting chart. APOCC were stained with Pkh red and were cocultured with eGFP E4+ECs for 2 days. E4+ECs (green) and OCCs (red) were gated through eGFP fluorescence intensity and Pkh red staining. d Real-time qPCR. APOCC and OVCAR3 were cocultured with E4+ECs for 2 days and sorted. The relative quantification of four Notch receptors was performed on APOCC and OVCAR3. e Real-time qPCR. APOCC and OVCAR3 were cocultured with E4+ECs for 2 days and sorted. The relative quantification of notch ligands Jagged1 (Jag1), Jagged2 (Jag2), DLL1, and DLL4 was performed on E4+ECs. f Quantification of Notch 3 expression. The upregulation of Notch3 by OCCs after coculture with E4+ECs was confirmed by Confocal microscopy. Scale bar 50 µm. g Real-time qPCR. Jag1 was quantified on E4+ECs scrambled or E4+ECs silenced for Jag1 (siJag1 E4+ECs). h Proliferation assay. APOCC and OVCAR3 were cocultured with scrambled E4+ECs or siJag1E4+ECs and counted every 2 days for 6 days. i Real-time qPCR. APOCC and OVCAR3 were cocultured with scrambled E4+ECs or siJag1E4+ECs and sorted. Notch downstream effectors Hes1 and Hey1 expression was assessed. j Cell cycle analysis. APOCC and OVCAR3 were cultured alone or cocultured with E4+ECs or siJag1E4+ECs for 2 days. Cell cycle analysis was performed by flow cytometry

