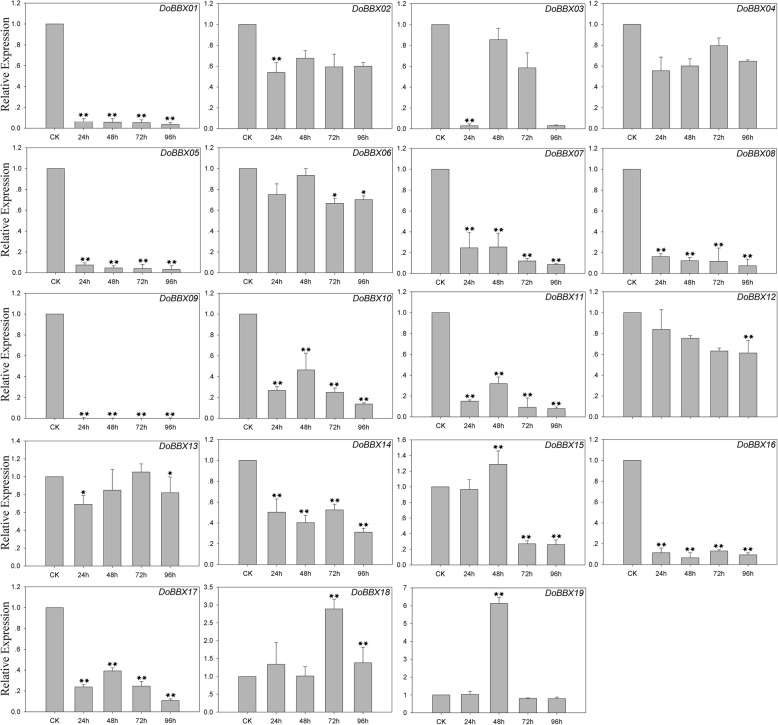
Fig. 9.
Expression patterns of DoBBX genes in D. officinale under AgNO3 treatment stresses as determined by qRT-PCR experiment. The x-axis indicated the time course of each stress treatment, and the y-axis represented the relative expression level. Mean values and standard deviations (SDs) indicated by error bars. ** significant difference (P < 0.01), * significant difference at P < 0.05

