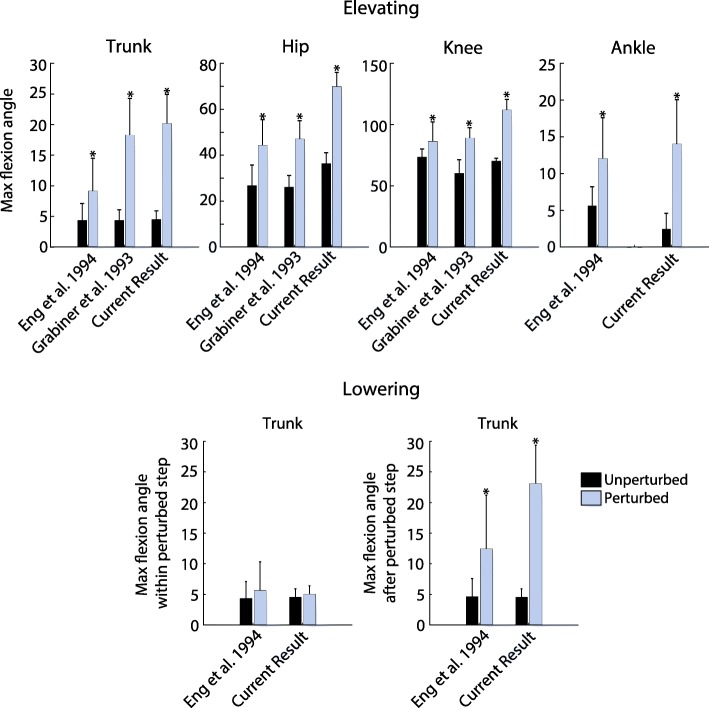
Fig. 8.
Peak joint angles for the elevating and lowering strategies. Results from this study as well as from previous works ([5, 15]) are reported. For this paper, the bars depict the inter-subject (N=7) mean of the average peak angles for each strategy, with inter-subject standard deviation displayed as error bars. For [5], the bars depict the total average peak angle for each strategy (n=25 stumbles for elevating, n=17 stumbles for lowering, n=25 for unperturbed control), with standard deviation displayed as error bars. For [15], the bars depict total average peak angles for the elevating strategy (n=42 stumbles), with standard deviation displayed as error bars. For the elevating strategy, peak flexion angle is defined as the peak joint angles of the ipsilateral limb and peak trunk deflection angle during the swing phase of the recovery. For the lowering strategy, peak trunk deflection angle within perturbed step (before the perturbed foot contacts the treadmill after perturbation) and after perturbed step (in the step following the perturbation) are reported. For the ankle, flexion refers to dorsiflexion. The unperturbed values shown for the current result are the inter-subject mean of the 25-stride average prior to the perturbation. Angles are reported in degrees. Asterisks above bars indicate that the value is significantly different from the same metric for unperturbed walking

