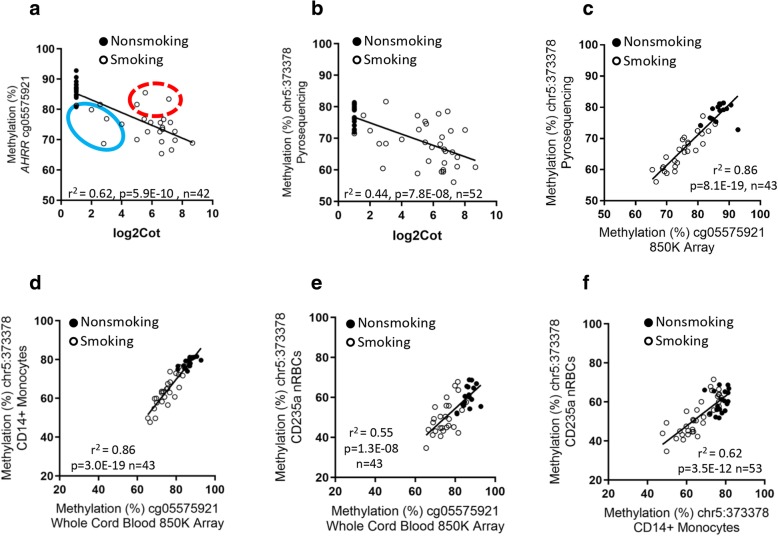
Fig. 1.
Log2 cotinine measurement in cord blood serum versus DNA methylation at cg05575921 (chr5:373378) measured by a 850K array and b pyrosequencing in cord blood DNA. Red circle indicates high cotinine relative to the methylation effect and blue circle indicates low cotinine relative to the methylation level. c Comparison of DNA methylation at cg05575921 measured by 850K array (x-axis) and pyrosequencing (y-axis) in cord blood DNA. d–f Comparison of DNA methylation at cg05575921 measured by 850K array in cord blood with methylation at chr5:373378 (genomic position of cg05575921) measured by pyrosequencing in DNA from: d CD14+ monocytes, and e CD235a+ nRBCs. f Comparison of methylation at chr5:373378 in CD14+ monocytes with CD235a+ nRBCs

