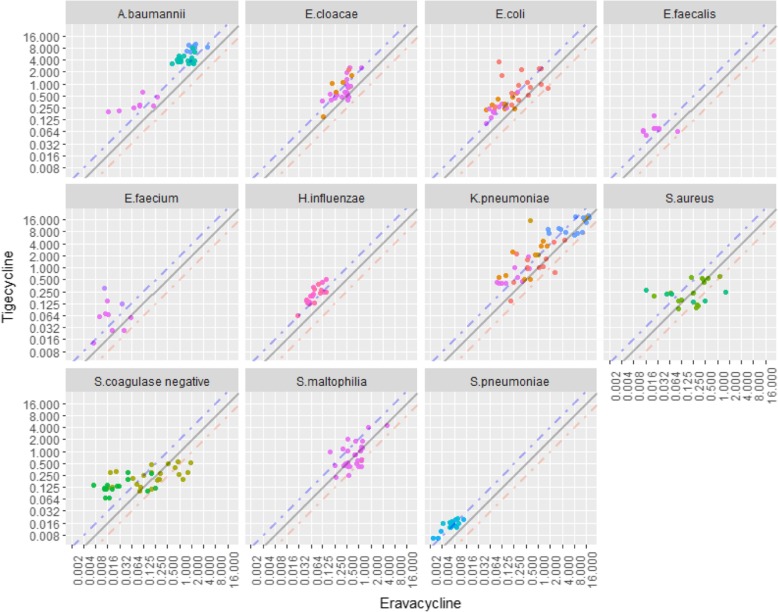
Fig. 1.
Scatter plot of MIC values of tigecycline versus MIC value of eravacycline against various bacteria. Note: A tiny displacement was made to the points in this figure in order to avoid overlapping of the strains with the same eravacycline and tigecycline MIC values. This tiny displacement can ensure the actual distribution of all strains visible. The points on the grey solid line indicated the strains shared the identical eravacycline and tigecycline MIC values. The points above the blue dash line indicated that the MIC values of tigecycline were greater than twice than the MIC values of eravacycline. The points below the orange dash line indicated that the MIC values of eravacycline were greater than twice than the MIC values of tigecycline
Legends:  Carbapenem resistant;
  ESBL;
ESBL;  mcr-1;
  MRCoNS;
  MRSA;
MRSA;  MSCoNS;
  MSSA;
MSSA;  OXA-23;
  PRSP;
PRSP;  PSSP;
PSSP;  Tigecycline resistant;
  VRE;
VRE;  without resistance gene;
  β-lactamases –;
  β-lactamases +.

