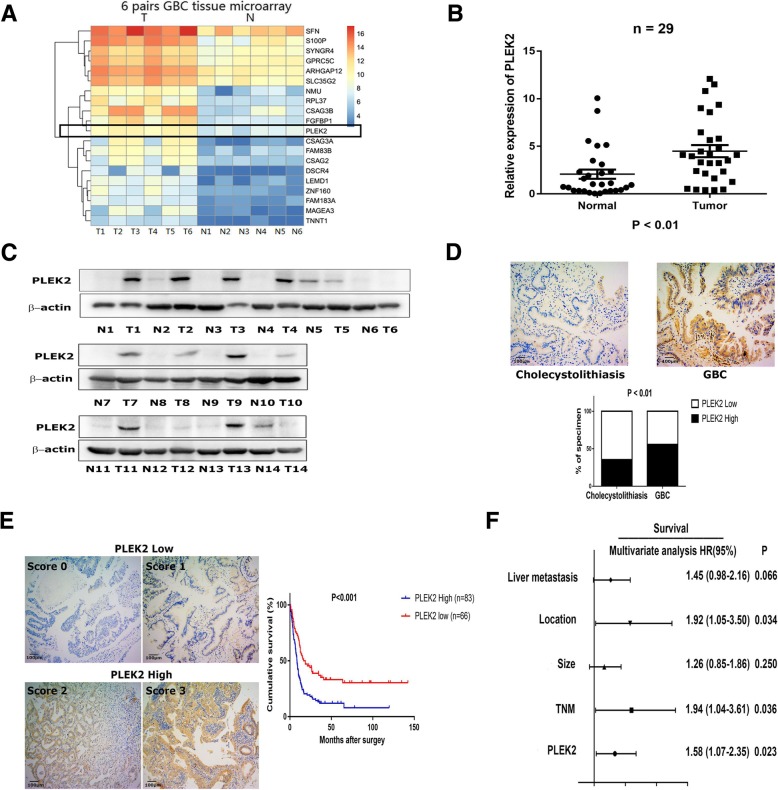
Fig. 1.
PLEK2 was up-regulated in gallbladder cancer and correlated with overall survival. a Heatmap results of a mRNA microarray consisted of six pairs of metastatic GBC and non-tumor samples. b, c The relative expression levels of PLEK2 in GBC tumor tissues (Tumor or T) and matched normal tissues (Non-Tumor or N) were detected by qRT-PCR (b) and western blot (c). d Representative IHC staining images of PLEK2 in cholecystolithiasis and GBC tissues, and quantification of PLEK2 expression according to IHC scores. e Representative IHC staining images of different scores calculated by intensity and percentage of stained cells and overall survival for the low and high PLEK2 expression groups. f Multivariate analysis of the factors associated with overall survival of GBC patients. All experiments were repeated at least three times, and data were analyzed using student’s t-test. *P < 0.05. Error bars indicate SEM

