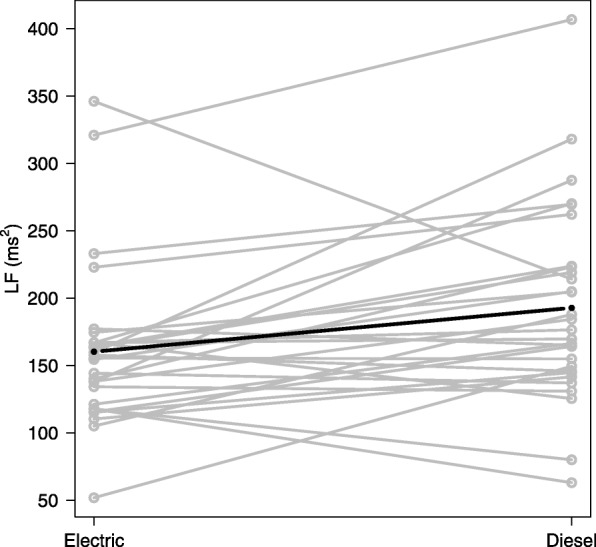
Fig. 3.

Low frequency (LF) component of heart rate variability measured after exposure in electric and diesel trains. The circles in grey represent LF measurements in electric train (one exposure scenario) or diesel train (mean of two exposure scenarios). The dark line represents the mixed-effects model without adjustments. Higher LF levels were observed on group level (solid symbols) after exposure in diesel trains (p < 0.05)
