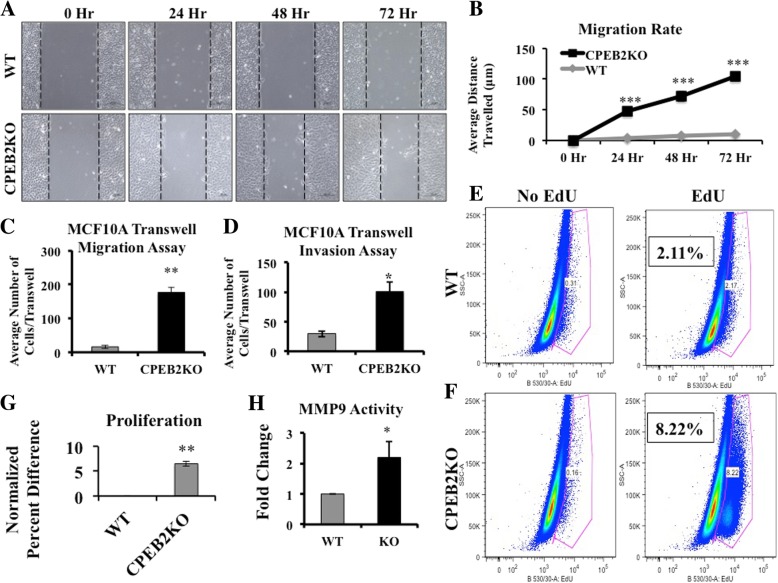
Fig. 3.
Comparison of migration, invasion and proliferation in WT and MCF10A CPEB2KO cells. a Representative images of WT and CPEB2KO MCF10A cells that were scratched and allowed to migrate in 1% Horse Serum, in the presence of mitomycin C to block proliferation. b Cell migration rate was measured as (distance at 0 h – distance at 24 h or 48 h or 72 h). WT cells migrated in a rate of 3.57 μm/day, whereas CPEB2KO cells migrated 35.82 μm/day. Scale = 100 μm. c Migration and (d) invasion of WT and CPEB2KO MCF10A cells in transwell chambers. Serum starved cells were allowed to migrate/invade in the presence of 5% Horse Serum in the bottom chamber. Cells were treated with Mitomycin C to block proliferation. The migration rate was 10.89 fold and invasion 3.43 fold in CPEB2KO cells relative to WT cells. e, f Proliferation (24 h EdU uptake measured with flow cytometry for immune-fluorescence) showing about 4 fold increase in CPEB2KO cells relative to WT cells in a representative assay. g Data presented as mean normalised % difference in proliferation between KO and WT cells (KO-WT)/WT. h Gelatinase A (MMP9) activity in WT and CPEB2KO MCF10A cells measured with densitometry of zymograms, WT cells normalised to 1. Quantitative data presented as mean of 3 ± SEM. (*) indicates p < 0.05, (**) p < 0.001, (***) p < 0.0005

