Fig. 4.
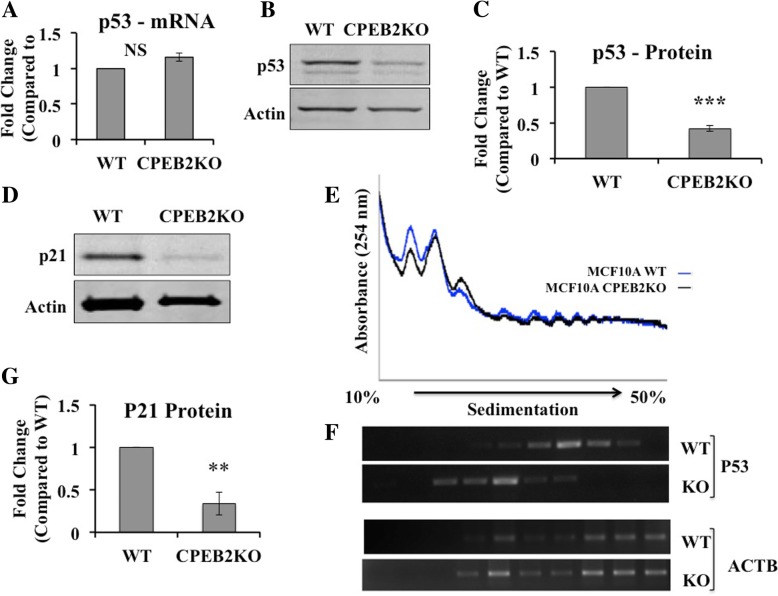
Translational regulation of p53 in CPEB2KO cells. a)qRT-PCR for p53 mRNA expression showing no difference between WT and CPEB2KO cells. b Western Blots for p53 and (c) quantification of western blots showing p53 protein expression was significantly reduced (to 0.41) in CPEB2KO cells. d, g p21 (downstream effector of p53) protein expression was significantly reduced (to 0.34) in CPEB2KO compared to WT cells. Western blot presented in (d) and quantitation in (g). Data represent mean of 3 replicates ± SEM. (**) indicates p < 0.001, (***) p < 0.0001. e Polysomal profiles of global protein translation in WT and CPEB2KO MCF10A cells showing no difference. f RT-PCR was performed to evaluate the distribution across a sucrose density gradient of ACTB and p53 mRNAs, showing that p53 mRNA was significantly shifted toward light polysomes in CPEB2KO cells

