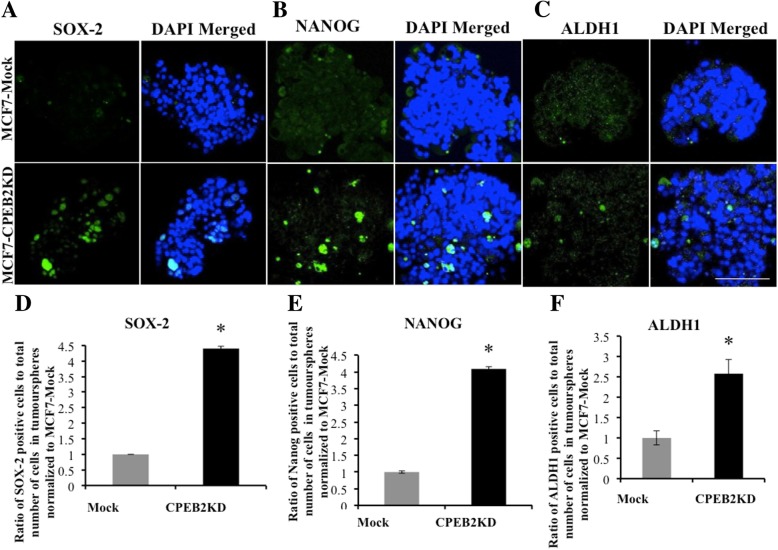
Fig. 6.
SLC markers in Mock and CPEB2KD MCF7 spheroids. Immunofluorescence images for SLC markers (a) SOX2, (b) NANOG and (c) ALDH1 in green, nuclei stained blue with DAPI in spheroids, (scale = 50 μm). Quantitative data for SLC markers, (d) for SOX2, (e) for NANOG and (f) ALDH1 showing an increase in markers bearing cells in CPEB2-KD spheroids compared to MCF7-Scramble spheroids. Data presented as mean of 3 replicates ± SEM (*) indicates p < 0.05

