
Fig. 1.
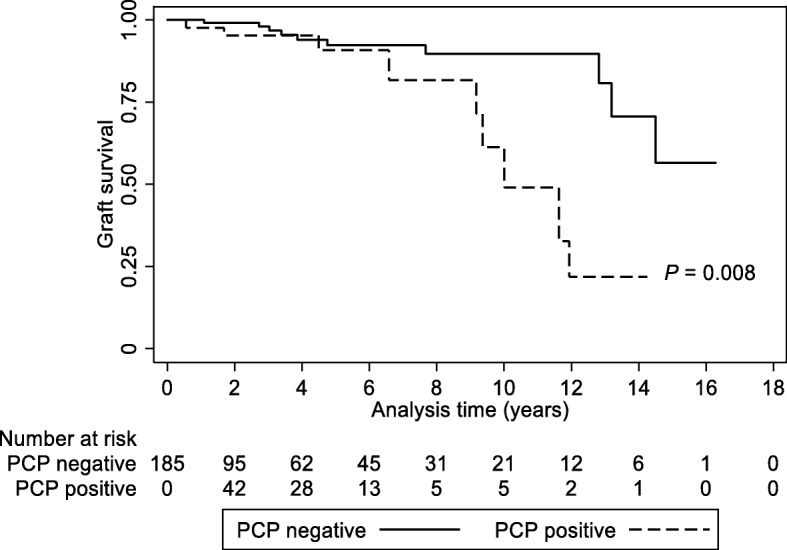
Overall graft survival curves in the PCP-positive and -negative patients. P value was obtained using the log-rank test. Dashed line, PCP-positive; solid line, PCP-negative
Official websites use .gov
A
.gov website belongs to an official
government organization in the United States.
Secure .gov websites use HTTPS
A lock (
) or https:// means you've safely
connected to the .gov website. Share sensitive
information only on official, secure websites.
Overall graft survival curves in the PCP-positive and -negative patients. P value was obtained using the log-rank test. Dashed line, PCP-positive; solid line, PCP-negative