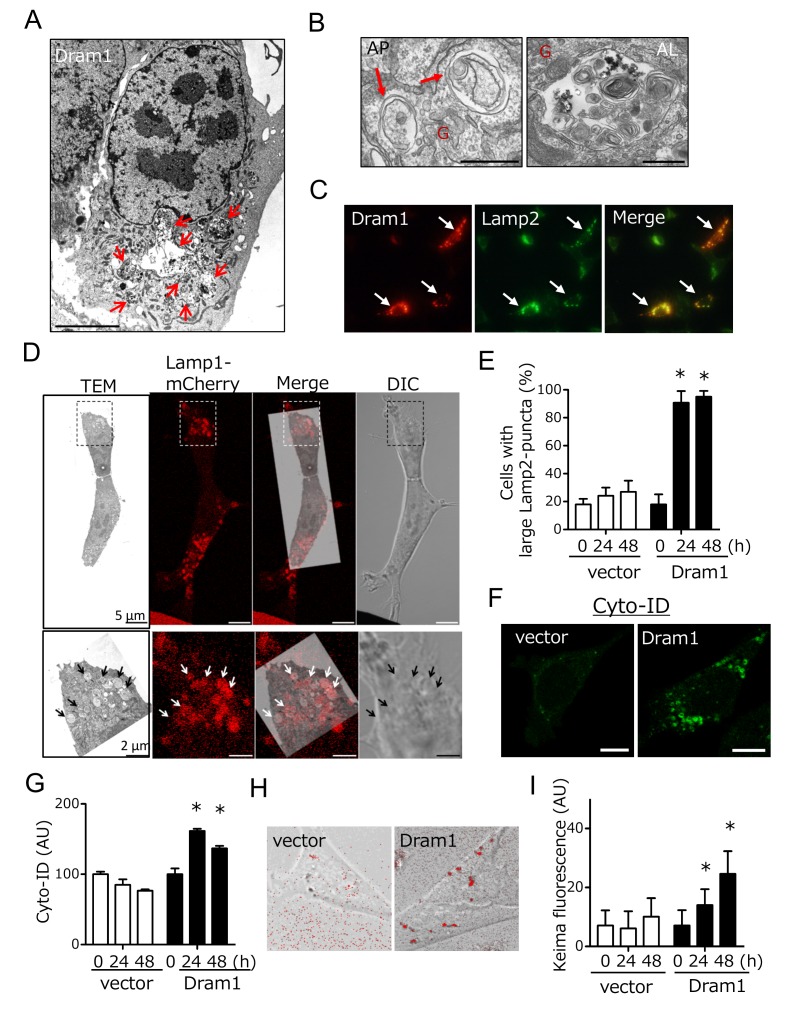
Figure 3. FIGURE 3: Induction of alternative autophagy in Atg5 KO MEFs by Dram1 expression.
(A, B) Electron micrographs of Atg5 KO MEFs 12 h after the transfection of dram1-flag. In (A), arrows indicate autolysosomes. Bar = 5 μm. In (B), a representative autophagosome (AP, left) and autolysosome (AL, right) are shown. Arrows indicate autophagosomes. "G" indicates Golgi membranes. Bar = 0.5 μm.
(C-E) Induction of alternative autophagy by Dram1 was assessed by Lamp2 immunostaining. In (C), Atg5 KO MEFs were transfected with dram1-flag for 24 h. The cells were then analyzed for immunofluorescence of Lamp2 and Flag. Arrows indicate Atg5 KO MEFs in which Dram1 was efficiently transfected. (D) Identification of autolysosomes as Lamp1-positive structures by CLEM. Lamp1-mCherry-expressing Atg5 KO MEFs were transfected with dram1-flag, and were incubated for 24 h. Then CLEM analysis was performed. The magnified images of the dashed squares are shown in the bottom panels. Lamp1-positive structures (red signals; arrows) were identical to large autolysosomes. (E) Atg5 KO MEFs were transfected with dram1-flag or control vector for the indicated times. The cells were then analyzed for immunofluorescence of Lamp2 and Flag. The percentage of cells with punctate Lamp2 immunofluorescence is shown as the mean + SD (n = 4). *p < 0.05 vs the value of "vector 0 h".
(F-I) Induction of alternative autophagy in etoposide-treated Atg5 KO MEFs by Dram1. Atg5 KO MEFs were transfected with dram1-flag or control vector for the indicated times. Alternative autophagy was then analyzed using Cyto-ID (F, G) and Keima (H, I). In (F) and (H), representative images at 24 h are shown. The extent of Cyto-ID fluorescence (G) and Keima fluorescence (I) is shown as the mean + SD (n = 4). *p < 0.05 vs the value of "vector 0 h".

