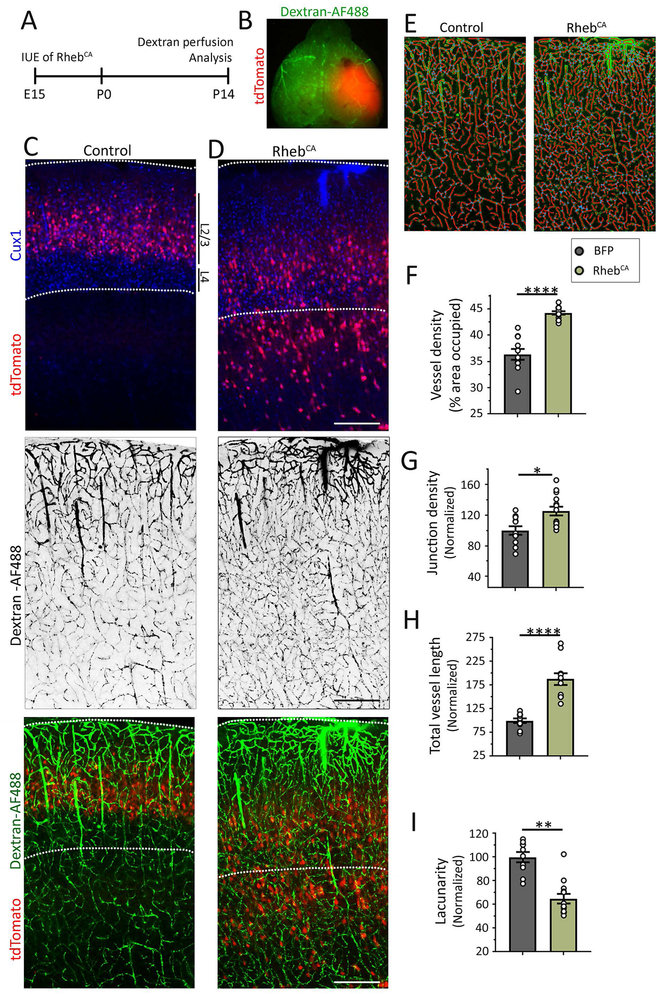
Figure 2: Focal MCD are associated with hypervascularization.
(A) Diagram of experimental design. (B) Image of the tdTomato-fluorescent MCD and dextran-AF488 fluorescence throughout the vessels. (C and D) Images of tdTomato-positive cells containing BFP (panels in C, BFP not shown) or RhebCA (panels in D) and Cux1 immunostaining (pseudo-colored blue), and images of dextran-AF488-filled blood vessels in black (middle panels) and in green superimposed with tdTomato-positive neurons (bottom panels) in coronal sections from the somatosensory cortex. Scale bars: 300 μm. (E) Examples of the modeling of blood vessels for analysis. (F-I) Bar graphs of vessel density (F), normalized junction density (G), normalized total vessel length (normalized to control and the area, H), and normalized lacunarity (I) in control (grey) and RhebCA (green) condition. N≥2 sections per mouse from 4-5 mice (datapoints= value per section). Student’s t-test, ****: P<0.0001, **:P<0.01, *:P<0.05.

