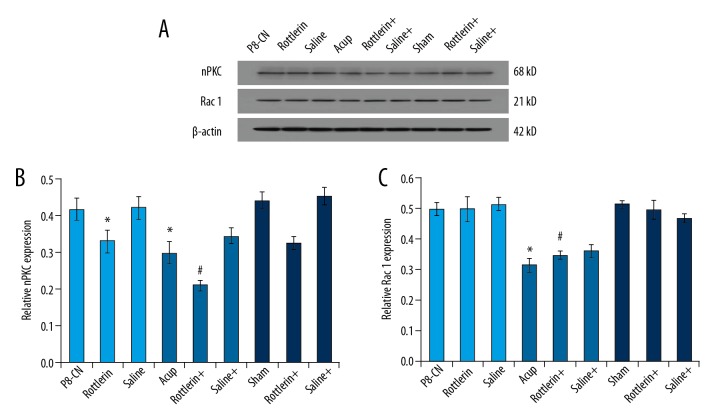
Figure 7.
(A) Examination of the nPKC and Rac 1 molecules in hippocampal by using western blot assay. (B) Western blot assay and statistical analysis for the nPKC expression in hippocampal. (C) Western blot assay and statistical analysis for the Rac 1 expression in hippocampal. * P<0.05 versus R1-CN group. # P<0.05 versus P8-Acup group.

