Abstract
Background
Studies have reported that BIS is unreliable in children because its algorithm provides misleading information about the actual depth of anesthesia. Raw EEG analysis provides direct neurophysiologic measurement of cerebral activity. The relationship between age and EEG has rarely been reported, thus the aim of the present study was to compare raw electroencephalography (EEG) among different age groups of surgical patients under general anesthesia with 1.0 MAC sevoflurane.
Material/Methods
We enrolled 135 patients aged 0–80 years old (ASA physical status I or II) undergoing surgery, who were divided into 6 groups: 1–12 months old (group 1), 1–3 years old (group 2), 3–6 years old (group 3), 6–18 years old (group 4), 18–65 years old (group 5), and 65–80 years old (group 6). Different raw EEG waves (alpha, delta, and theta) were compared for all subjects.
Results
The BIS values in groups 1 to 6 were 52.2±12.7, 55.0±8.0, 44.5±7.3, 43.8±7.3, 44.2±6.2, and 49.1±6.2 respectively. Compared with groups 1 and 2 (52.2±12.7, 55.0±8.0), BIS values of groups 3, 4, and 5 (44.5±7.3, 43.8±7.3, 44.2±6.2, respectively) were lower (P<0.05). Theta frequency was observed in the 6 groups. The EEG frequencies in groups 1 to 6 were 6.0 (5.5–6.0), 6.0 (5.5–6.0), 6.0 (5.5–6.0), 6.0 (6.0–7.0), 6.3 (6.0–7.0), and 6.0 (5.1–6.0), respectively. Compared with group 6, EEG frequencies in groups 4 and 5 were higher (P<0.05). BIS value was significantly correlated with EEG frequency (R2=0.063, P<0.01).
Conclusions
Analyzing raw EEG waves provides more accurate judgement of depth of anesthesia, especially in pediatric cases in which monitors often provide misleading values.
MeSH Keywords: Age Groups; Anesthetics, Inhalation; Consciousness Monitors; Electroencephalography
Background
In modern practice, assessment of the depth of anesthesia is fundamental to anesthesiology. Depth of anesthesia and electrical brain activity can be assessed using electroencephalogram monitors (BIS-Bispectral Index and M-Entropy), which are designed to avoid phases of inadequate or profound anesthesia and to prevent awareness [1]. However, recent studies have reported that BIS is unreliable in children because its algorithm provides misleading information about the actual depth of anesthesia [2,3]. Although it may appear complex, raw electroencephalogram (EEG) monitoring provides useful insights about how the EEG waves correlate to the hypnotic level of anesthesia because the anesthetic agents generate continuous changes in the neurological activity in terms of frequency and amplitude [4,5]. Raw EEG analysis provides a direct neurophysiologic measurement of electrical cerebral activity [6]. Related reports have demonstrated that the raw EEG can be easily influenced by age, increasing anesthetic concentration, noxious stimuli, and hemodynamic disturbances [7,8]. With increasing anesthetic concentrations, the EEG activity is attenuated until it reaches a flat line called the burst suppression, whereas noxious stimuli cause EEG desynchronization to low amplitude fast waves. Cerebral hypo-perfusion triggered by decrease in hemodynamics causes EEG depression. The changes in the raw EEG frequency related to age reflect the time course of the brain growth, which entails a well-defined structural and functional spatiotemporal development pattern in embryogenesis, infancy, childhood, adolescence, adulthood, and senescence [9].
However, the relationship between age and raw EEG has been rarely reported. The aim of this study was to observe the presented brain waves (alpha, theta, and delta) under general anesthesia with 1.0 MAC sevoflurane and to assess how their frequencies differ in different age groups. We hypothesized that at 1.0 MAC sevoflurane, with the use of opioids and no surgical stimulus, the raw EEG frequencies vary in different age groups, and that analyzing the raw EEG is much more consistent than depending on the monitors.
Material and Methods
This clinical trial was registered at https://clinicaltrials.gov with registration number NCT03559504. After obtaining approval from the Local Research Ethics Committee (Number LCKY2018-09) and written informed consent, 135 patients, aged 0–80 years old, ASA I or II, undergoing elective orthopedic or abdominal surgery (≤2 h), were sequentially enrolled into the study (from January to September 2018 at the Second Affiliated Hospital and Yuying Children’s Hospital of Wenzhou Medical University), as shown in Figure 1. The selected patients were divided into 6 groups (20 cases in each group) according to age: 1–12 months old (infant period, group 1), 1–3 years old (toddler period, group 2), 3–6 years old (preschool age period, group 3), 6–18 years old (school age period, group 4), 18–65 years old (adults, group 5), and 65–80 years old (the elderly, group 6). We excluded patients with hypertension, cerebrovascular disease, any neurological disease, obesity (body mass index ≥30 kg/m2), contraindication to sevoflurane, pregnancy, and those using central nervous system active drugs or illicit drugs. Patients with poor-quality data or any loss of data were also excluded.
Figure 1.
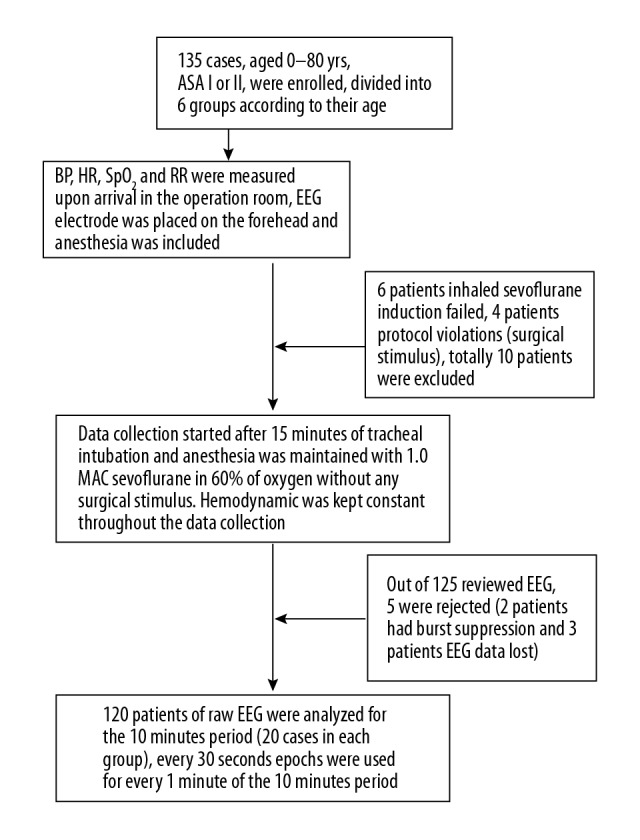
Flow chart of the study.
After arrival in the operating room, an indwelling cannula was inserted into a peripheral vein in the forearm for the induction of general anesthesia. Monitoring consisted of noninvasive systolic, diastolic and mean blood pressure (SBP, DBP, MBP), heart rate (HR), pulse oximetry (SpO2), respiration rate (RR), and electrocardiogram (IntelliVue MP70; Philips, Amsterdam, Netherlands). End-tidal partial pressure of carbon dioxide (PETCO2) and end-tidal sevoflurane concentration (ET Sev) were also monitored continuously. In addition to the standard monitors, the BIS electrode (Coviden BIS Quatro, XP Sensor), which was connected to an A-2000 BIS monitor (XP version: Aspect Medical System, Newton, MA), was placed on the skin of each patient’s forehead as recommended by the manufacturer before the induction of anesthesia. Patients were fasted for at least 8 h and were not pre-medicated. Anesthesia was induced through mask inhalation of 6% sevoflurane in 100% oxygen with a flow rate of 4 L/min, followed by intravenous administration of sufentanil 0.2–0.3 μg/kg and cisatracurium 0.2 mg/kg to facilitate tracheal intubation. After tracheal intubation, all patients were mechanically ventilated with a fresh gas flow of 2 L/min of 60% oxygen in air and with tidal volume of 6–8 ml/kg using the Dräger Zeus® anesthesia device (Dräger, Lübeck, Germany). Tidal volume and respiratory rates were adjusted to maintain a PETCO2 of 30–35 mmHg in all 6 groups. Maintenance of anesthesia was carried out with 1.0 MAC inhalation of sevoflurane according to the age groups (the end-tidal sevoflurane concentrations were set at 2.7, 2.7, 2.6, 2.6, 2.0, and 1.7, respectively, for group 1 to group 6) [10]. Patients with episodes of oxygen desaturation (SpO2 <95%) and arrhythmia were excluded during the study. Hypotension, defined as a decrease in blood pressure by 25% from baseline or from pre-induction values, was treated with intravenous fluid and phenylephrine (0.5 μg/kg). Data collection (SBP, DBP, MBP, HR, RR, SpO2, EEG wave frequencies, ET Sev, and BIS values) started 15 min after tracheal intubation, ensuring that the end-tidal partial pressure of sevoflurane in the brain was in equilibrium with that in the arterial blood, which was based on the protocol of Blain-Moraes et al. [11]. The raw EEG data were continuously recorded over a period of 10 min using an Aspect A-2000 BIS® monitor (XP version: Aspect Medical System, Newton, MA), which was acquired by means of a Universal Serial Bus (USB) for offline processing. Raw EEG data, BIS values, and ET Sev were recorded every minute for a period of 10 min (T1 to T10), whereas routine monitoring of HR, RR, SBP, DBP, MBP, and SpO2 were recorded every 3 min, which started at baseline T0 and continued throughout the 10-min period of EEG recording at time points T3, T6, and T9. Hemodynamics at time points T0, T3, T6, and T9 coincided with the same time points of the raw EEG data recording. Raw EEG data were processed offline using the PDF screenshots from the Aspect A-2000 BIS® monitor and were analyzed in real time. Frontal raw EEG recordings of each patient (at positions Fp1, Fp2, F7, and F8, with ground electrode at Fpz) were analyzed offline on a personal computer, and for every 1 min of EEG recording, 30-s epochs were chosen. The electrode impedances were less than 2 kΩ throughout the study. Data acquisition was carried out without any surgical stimulus, and, after completion, the surgery began as scheduled. At the end of the operation, patients were extubated and the time duration was noted.
Statistical analysis
Sample size was determined based on a priori power analysis, which indicated that at least 19 patients per group would be sufficient to detect a change of 1 Hz in the EEG frequency with a power greater than 80% at the level of significance of <0.05. All analyses and graph creations were performed using SPSS 23.0 software for windows (SPSS Inc., Chicago, IL) and GraphPad Prism 6.01 (GraphPad Prism, Prism 6.01; www.graphpad.com). For descriptive analyses, number or percentage was used for categorical variables, and median with interquartile range (IQR) (25–75 interquartile) or mean with SD were used for continuous variables. Categorical data were calculated using Fisher’s exact test. Data related to HR, MBP, RR, and SpO2, (Baseline T0, T3, T6, T9) and data on EEG frequencies, ET Sev, and BIS values, (T1 to T10) in the 6 groups were compared using 2-way ANOVA for repeated measurements. One-way ANOVA was used for mean BIS values and ET Sev with the application of Bonferroni correction to the post hoc analysis. The Kruskal-Wallis H test was used to analyze the median of the EEG frequency, and the post hoc Dunn’s multiple comparisons test was applied to the analysis. The relationships between EEG frequencies, BIS values, age, weight, and BMI were evaluated by multiple linear regressions, where EEG was the independent variable. Data are presented as mean ± standard deviation (SD), n (%), or median (interquartile range). A P value <0.05 was considered statistically significant.
Results
A total of 135 patients scheduled for elective surgery under general anesthesia were enrolled, with 120 patients eventually included in the data analysis (Figure 1). The demographic characteristics, including age, sex, weight, and body mass index (BMI), of the 120 patients are shown in Table 1. All procedures of tracheal intubations were performed successfully, and hemodynamics was kept constant throughout the 10 min of raw EEG analysis (Figures 2, 3).
Table 1.
Patient data and clinical characteristics (n=20).
| Variables | Group 1 | Group 2 | Group 3 | Group 4 | Group 5 | Group 6 |
|---|---|---|---|---|---|---|
| Age (yrs) | 0.6±0.3 | 1.3±0.5 | 4.6±0.9 | 9.5±1.8 | 44.7±11.9 | 70.7±3.9 |
| Sex (M/F) | 12/8 | 16/4 | 15/5 | 16/4 | 8/12 | 11/9 |
| Weight (kg) | 8.5±2.3 | 11.6±2.0 | 20.4±5.1 | 32.6±8.5 | 63.0±11.5 | 61.6±8.3 |
| BMI (kg/m2) | 17.7±2.4 | 16.9±2.3 | 16.2±3.8 | 17.2±3.1 | 23.8±3.2 | 23.6±1.9 |
Figure 2.
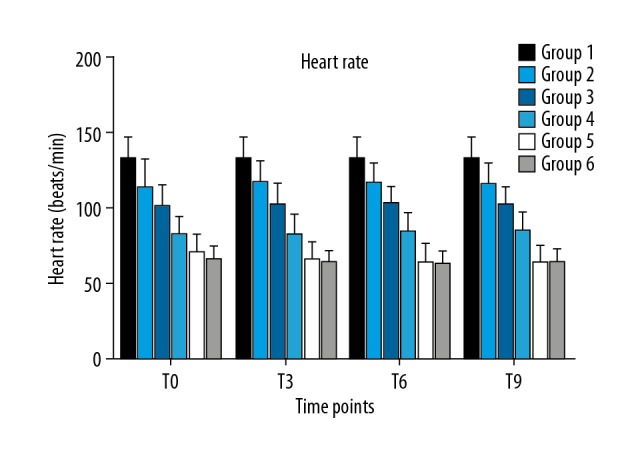
Heart rate among the 6 groups at different time points.
Figure 3.
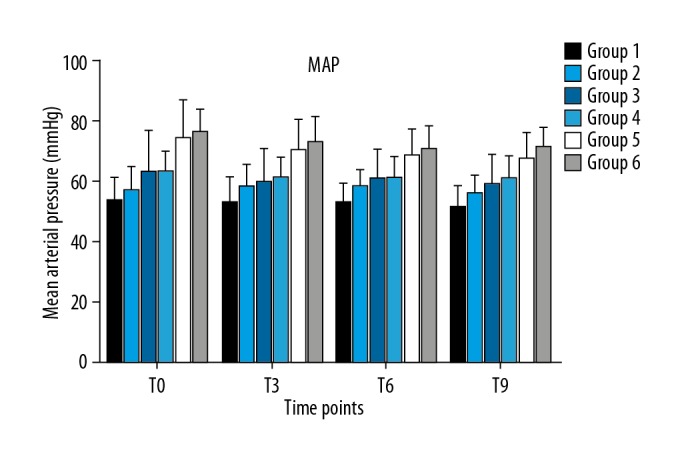
Mean arterial pressure among the 6 groups at different time points.
The dynamic changes of BIS values per minute are shown in Figure 4. During the 10-min observation period, the average BIS values in group 1 to group 6 were 52.2±12.7, 55.0±8.0, 44.5±7.3, 43.8±7.3, 44.2±6.2, and 49.1±6.2, respectively. Compared with groups 1 and 2 (52.2±12.7, 55.0±8.0), the average BIS values of groups 3, 4, and 5 (44.5±7.3, 43.8±7.3, 44.2±6.2, respectively) were lower (P<0.05), as shown in Table 2 and Figure 4.
Figure 4.
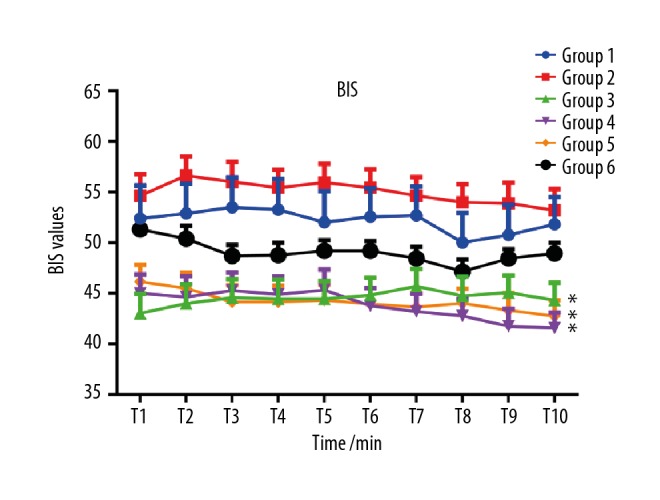
Dynamic changes of BIS values at each minute of observation. Compared with groups 1 and 2, the average BIS values of groups 3, 4, and 5 were lower (* P<0.05).
Table 2.
Values of EEG Frequency, BIS, and Et SEV among the 6 groups (n=20).
| Variable | Group 1 | Group 2 | Group 3 | Group 4 | Group 5 | Group 6 | P value |
|---|---|---|---|---|---|---|---|
| EEG Frequency/Hz | 6.0 (5.5–6.0) | 6.0 (5.5–6.0) | 6.0 (5.5–6.0) | 6.0* (6.0–7.0) | 6.3* (6.0–7.0) | 6.0 (5.1–6.0) | 0.0013 |
| BIS value | 52.2±12.7 | 55.0±8.0 | 44.5±7.5ab | 43.8±7.3ab | 44.2±6.2ab | 49.1±4.2 | 0.000013 |
Data are expressed as mean ±SD or median (interquartile range 25–75), one-way ANOVA, or Kruskal-Wallis H test. Compared with Group 6,
P<0.05; compared with Group 1,
P<0.05; compared with Group 2,
P<0.05.
Theta EEG frequency was observed in all 6 groups under 1.0 MAC sevoflurane anesthesia, and there were no alpha (α) or beta (β) waves presented. The median EEG frequencies in group 1 to group 6 was 6.0 (5.5–6.0), 6.0 (5.5–6.0), 6.0 (5.5–6.0), 6.0 (6.0–7.0), 6.3 (6.0–7.0) and 6.0 (5.1–6.0), respectively; Dunn’s multiple comparisons test found statistically significant differences only in group 4 vs. group 6 and in group 5 vs. group 6 (P<0.05), as shown in Table 2 and Figure 5. Multiple linear regression with forward method showed that BIS value was significantly correlated to EEG wave frequency (R2=0.063, Standardized Coefficients=0.25, P<0.01). Age, weight, and BMI were not significantly different among groups.
Figure 5.
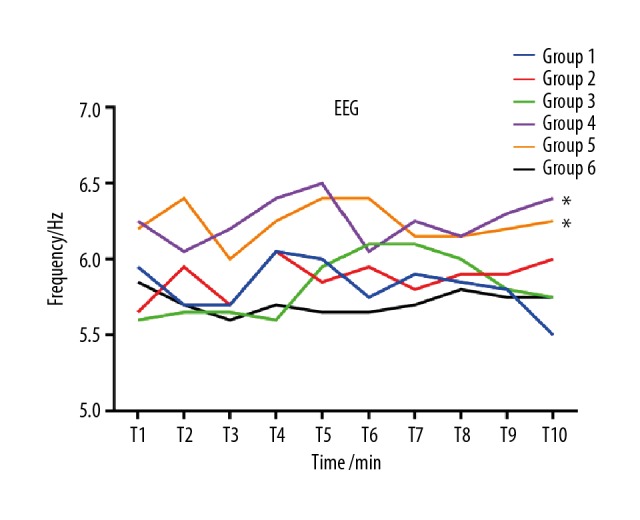
Dynamic changes of EEG frequency at different time points. Compared with group 6, the median EEG frequencies in groups 4 and 5 were higher (* P<0.05).
Discussion
The main outcome of this study is the finding that under general anesthesia with 1.0 MAC sevoflurane, some pediatric patients had higher BIS values, and theta waves (4–8 Hz) were observed in all subjects. Alpha and beta waves were absent in all 6 groups, and the BIS value was significantly correlated to the raw EEG wave frequency.
Tokuwaka et al. [12] stated that under sevoflurane anesthesia, BIS values are unreliable in children age < 2 years when assessing the depth of anesthesia. Wodey et al. [13] reported that the BIS values ranged from 20 to 74 (median 40) under 1.0 MAC of sevoflurane in children, and the EEG and BIS measured appeared to be strongly correlated with age. Our results showed similar findings in pediatric cases with BIS values in the range of 24 to 74, with 14 children under 2 years old having BIS values greater than 60, even though the raw EEG waves showed theta coherence. The inaccuracy of brain monitors for pediatric patients can be explained by changes occurring in the brain during development, such as apoptosis, neurogenesis, axonal-dendritic growth, and synaptogenesis, which begins after birth, with synaptic density peaking at around 2 years old [9]. These developments are not reflected by the monitors, as the BIS algorithm is derived only for adults. The other groups had BIS values in the range of 40–60, which are suggestive of its accuracy in such cases, but they are not reliable in pediatric patients. Hence, assessing the raw EEG waves in children is more precise than relying on the monitors [14].
Although theta coherence was observed in all age groups, the frequencies differed in group 5, showing higher power in adults than in children and the elderly. EEG wave interpretation depends on state of consciousness, which varies according to the development and maturation of the central nervous system, and also depends on age [15]. The peak maturity of EEG is in the adulthood period; after 30 years of age it declines with increasing age, showing that infants and the elderly have similar EEG properties [15]. Changes in raw EEG frequency related to age reflect the time course development of the brain, which contains a series of neurons and cells that follow a functional spatiotemporal development pattern [16]. Darren et al. [17] reported that alpha rhythm frequency was decreased and transitioned into theta waves when anesthetic concentration was increased. However, it has been reported that anterior alpha rhythm was associated with propofol-induced unconsciousness [18]. Furthermore, Oluwaseun Akeju et al. [19] reported that sevoflurane exhibited a theta coherence that was absent under propofol anesthesia. Blain-Moraes et al. [11] stated that in a steady-state induction of unconsciousness, sevoflurane was not characterized by alpha rhythms in the frontal cortex. While EEG waves can be affected by surgical stimulus and opioids, Hagihira et al. [20] reported that BIS values and EEG frequency and amplitude can be altered at incision. EEG waveforms are usually dependent on the electrode position [21]. In the present study, only the frontal EEG was monitored, and sevoflurane was the sole anesthetic agent used for both induction and maintenance of anesthesia. Thus, the fact that only theta waves were manifested in our study may be due to the electrodes positioning, the choice of anesthetic agent and its concentration, and lack of surgical stimulus.
Brain monitoring has been proven to be very valuable in clinical practice, such as anesthetic consumption, brain perfusion, determining the level of anesthesia, and reducing intraoperative awareness [22]. EEG waves offer useful information about the depth of anesthesia according to drastic changes observed in the wave pattern when the anesthetic concentration is being increased or upon significant stimulation, which are often not represented by the monitors. Therefore, it enables the anesthesiologist to deliver appropriate care by protecting the brain and preventing awareness. However, in current practice, the use of raw EEG in assessing depth of anesthesia is limited because the majority of clinicians do not have the time or the skills to interpret the complexity of the raw EEG data to titrate the delivery of anesthesia [23]. Most anesthesiologists assess the depth of anesthesia by depending on the BIS values. Hagihira et al. [21] stated that most anesthesiologists should be able to interpret and reliably judge the effects of anesthetic agents on the raw EEG waves after just 1 or 2 weeks of training.
Our study has some limitations. Firstly, the intraoperative awareness of the patients was not assessed after surgery. Secondly, the raw EEG waves were observed at only 1 concentration (1.0 MAC of sevoflurane).
Conclusions
In summary, raw EEG monitoring provides real-time information about the actual level of anesthesia, and analyzing the raw EEG waves provides reliable assessment of the depth of anesthesia, especially in pediatric cases, in which the monitors tend to provide misleading values. Theta waves are indicative of a deep hypnotic level.
Footnotes
Source of support: The research was funded by Wenzhou Science and Technology Foundation of China (Y20160131), Zhejiang Provincial Public Welfare Technology Application Research Foundation Of China (2018ZD033), and Zhejiang Provincial Public Welfare Technology Application Research Foundation of China (2015C33100)
Conflicts of interest
None.
References
- 1.Shalbaf R, Behnam H, Jelveh Moghadam H. Monitoring depth of anesthesia using combination of EEG measure and hemodynamic variables. Cogn Neurodyn. 2015;9:41–51. doi: 10.1007/s11571-014-9295-z. [DOI] [PMC free article] [PubMed] [Google Scholar]
- 2.Davidson AJ, Huang GH, Rebmann CS, Ellery C. Performance of entropy and Bispectral Index as measures of anaesthesia effect in children of different ages. Br J Anaesth. 2005;95:674–79. doi: 10.1093/bja/aei247. [DOI] [PubMed] [Google Scholar]
- 3.Wallenborn J, Kluba K, Olthoff D. Comparative evaluation of Bispectral Index and Narcotrend Index in children below 5 years of age. Paediatr Anaesth. 2007;17:140–47. doi: 10.1111/j.1460-9592.2006.02036.x. [DOI] [PubMed] [Google Scholar]
- 4.Michels P, Brauer A, Bauer M, Sohle M. Neurophysiological monitoring during surgical procedures. Anaesthesist. 2017;66:645–59. doi: 10.1007/s00101-017-0356-7. [DOI] [PubMed] [Google Scholar]
- 5.Schneider G, Jordan D, Schwarz G, et al. Monitoring depth of anesthesia utilizing a combination of electroencephalographic and standard measures. Anesthesiology. 2014;120:819–28. doi: 10.1097/ALN.0000000000000151. [DOI] [PubMed] [Google Scholar]
- 6.Kertai MD, Whitlock EL, Avidan MS. Brain monitoring with electroencephalography and the electroencephalogram-derived bispectral index during cardiac surgery. Anesth Analg. 2012;114:533–46. doi: 10.1213/ANE.0b013e31823ee030. [DOI] [PMC free article] [PubMed] [Google Scholar]
- 7.McKay ID, Voss LJ, Sleigh JW, et al. Pharmacokinetic-pharmacodynamic modeling the hypnotic effect of sevoflurane using the spectral entropy of the electroencephalogram. Anesth Analg. 2006;102:91–97. doi: 10.1213/01.ane.0000184825.65124.24. [DOI] [PubMed] [Google Scholar]
- 8.Vanhatalo S, Tallgren P, Becker C, et al. Scalp-recorded slow EEG responses generated in response to hemodynamic changes in the human brain. Clin Neurophysiol. 2003;114:1744–54. doi: 10.1016/s1388-2457(03)00163-9. [DOI] [PubMed] [Google Scholar]
- 9.Akeju O, Pavone KJ, Thum JA, et al. Age-dependency of sevoflurane-induced electroencephalogram dynamics in children. Br J Anaesth. 2015;115(Suppl 1):i66–76. doi: 10.1093/bja/aev114. [DOI] [PMC free article] [PubMed] [Google Scholar]
- 10.Nakajima R, Nakajima Y, Ikeda K. Minimum alveolar concentration of sevoflurane in elderly patients. Br J Anaesth. 1993;70:273–75. doi: 10.1093/bja/70.3.273. [DOI] [PubMed] [Google Scholar]
- 11.Blain-Moraes S, Tarnal V, Vanini G, et al. Neurophysiological correlates of sevoflurane-induced unconsciousness. Anesthesiology. 2015;122:307–16. doi: 10.1097/ALN.0000000000000482. [DOI] [PMC free article] [PubMed] [Google Scholar]
- 12.Tokuwaka J, Satsumae T, Mizutani T, et al. The relationship between age and minimum alveolar concentration of sevoflurane for maintaining bispectral index below 50 in children. Anaesthesia. 2015;70:318–22. doi: 10.1111/anae.12890. [DOI] [PubMed] [Google Scholar]
- 13.Wodey E, Tirel O, Bansard JY, et al. Impact of age on both BIS values and EEG bispectrum during anaesthesia with sevoflurane in children. Br J Anaesth. 2005;94:810–20. doi: 10.1093/bja/aei140. [DOI] [PMC free article] [PubMed] [Google Scholar]
- 14.Cornelissen L, Kim SE, Purdon PL, et al. Age-dependent electroencephalogram (EEG) patterns during sevoflurane general anesthesia in infants. eLife. 2015;4:e06513. doi: 10.7554/eLife.06513. [DOI] [PMC free article] [PubMed] [Google Scholar]
- 15.Speckmann EJ, Elger CE, Gorji A. Neurophysiologic basis of EEG and DC potentials. In: Schomer DL, Lopes da Silva FH, editors. Niedermeyer’s Electroencephalography: Basic Principles, Clinical Applications and Related Fields. 6th ed. Philadelphia: Lippincott, Williams & Wilkens; 2011. pp. 181–210. [Google Scholar]
- 16.Power JD, Fair DA, Schlaggar BL, Petersen SE. The development of human functional brain networks. Neuron. 2010;67:735–48. doi: 10.1016/j.neuron.2010.08.017. [DOI] [PMC free article] [PubMed] [Google Scholar]
- 17.Hight D, Voss LJ, Garcia PS, Sleigh J. Changes in alpha frequency and power of the electroencephalogram during volatile-based general anesthesia. Front Syst Neurosci. 2017;11:36. doi: 10.3389/fnsys.2017.00036. [DOI] [PMC free article] [PubMed] [Google Scholar]
- 18.Soplata AE, McCarthy MM, Sherfey J, et al. Thalamocortical control of propofol phase-amplitude coupling. PLoS Comput Biol. 2017;13:e1005879. doi: 10.1371/journal.pcbi.1005879. [DOI] [PMC free article] [PubMed] [Google Scholar]
- 19.Akeju O, Westover MB, Pavone KJ, et al. Effects of sevoflurane and propofol on frontal electroencephalogram power and coherence. Anesthesiology. 2014;121:990–98. doi: 10.1097/ALN.0000000000000436. [DOI] [PMC free article] [PubMed] [Google Scholar]
- 20.Hagihira S, Takashina M, Mori T, et al. Electroencephalographic bicoherence is sensitive to noxious stimuli during isoflurane or sevoflurane anesthesia. Anesthesiology. 2004;100:818–25. doi: 10.1097/00000542-200404000-00011. [DOI] [PubMed] [Google Scholar]
- 21.Hagihira S. Changes in the electroencephalogram during anaesthesia and their physiological basis. Br J Anaesth. 2015;115(Suppl 1):i27–31. doi: 10.1093/bja/aev212. [DOI] [PubMed] [Google Scholar]
- 22.Johansen JW. Update on bispectral index monitoring. Best Prac Res Clin Anaesthesiol. 2006;20:81–99. doi: 10.1016/j.bpa.2005.08.004. [DOI] [PubMed] [Google Scholar]
- 23.Hajat Z, Ahmad N, Andrzejowski J. The role and limitations of EEG-based depth of anaesthesia monitoring in theatres and intensive care. Anaesthesia. 2017;72(Suppl 1):38–47. doi: 10.1111/anae.13739. [DOI] [PubMed] [Google Scholar]


