Figure 4.

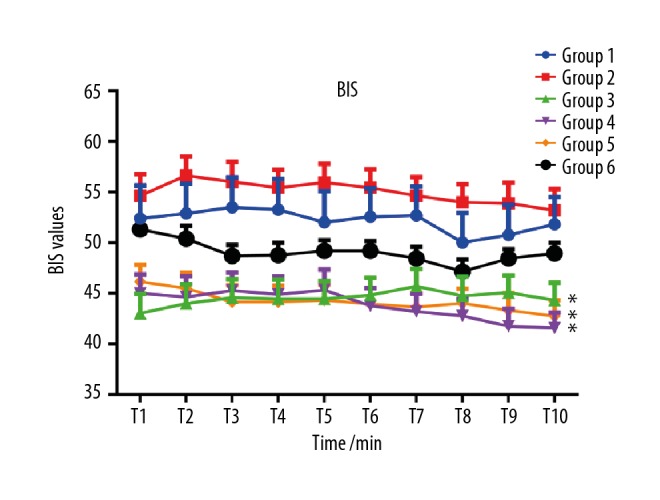
Dynamic changes of BIS values at each minute of observation. Compared with groups 1 and 2, the average BIS values of groups 3, 4, and 5 were lower (* P<0.05).

Dynamic changes of BIS values at each minute of observation. Compared with groups 1 and 2, the average BIS values of groups 3, 4, and 5 were lower (* P<0.05).