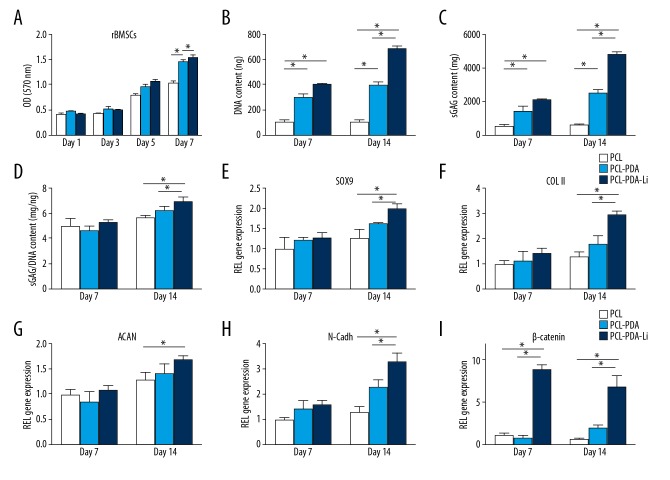
Figure 4.
(A) Biocompatibility analysis of the scaffolds by MTT. DNA (B) and GAG (C) production and GAG/DNA (D) by rBMSCs cultured on scaffolds (* p<0.05). (E–I) The gene expression of rBMSCs cultured on the PCL, PCL-PDA, and PCL-PDA-Li scaffolds at 7 and 14 days. All data were normalized to the corresponding GAPDH value (* p<0.05).

