
Figure 3.
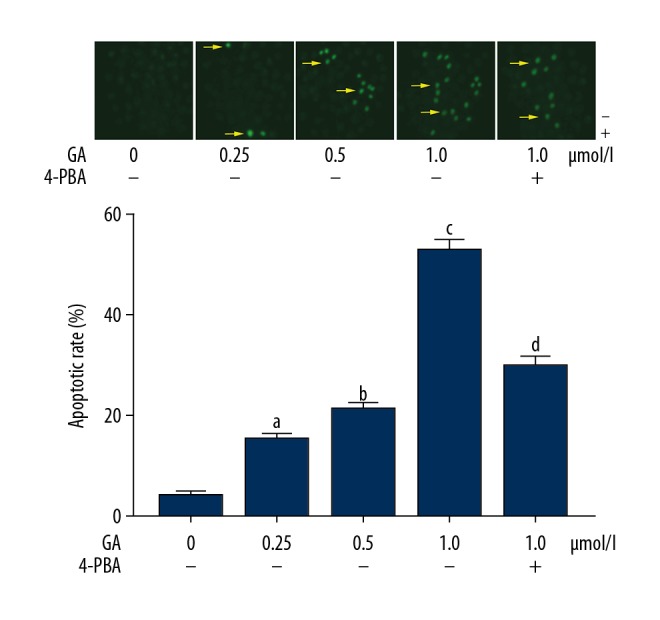
The upper panel demonstrates the captured images of TUNEL fluorescent staining of A549 cells incubated with gambogic acid (GA) at concentrations of 0, 0.25, 0.5, and 1.0 μmol/l. TUNEL-positive cells were tagged by green fluorescence, indicated by yellow arrows. Columns on the lower panel indicate the apoptotic rate of A549 cells. [a Differences were statistically significant compared with control (p<0.05); b Differences were statistically significant compared with cells incubated with GA at 0.25 μmol/l; c Differences were statistically significant compared with cells incubated with GA at 0.5 μmol/l; d Differences were statistically significant compared with cells incubated with GA at 1.0 μmol/l].