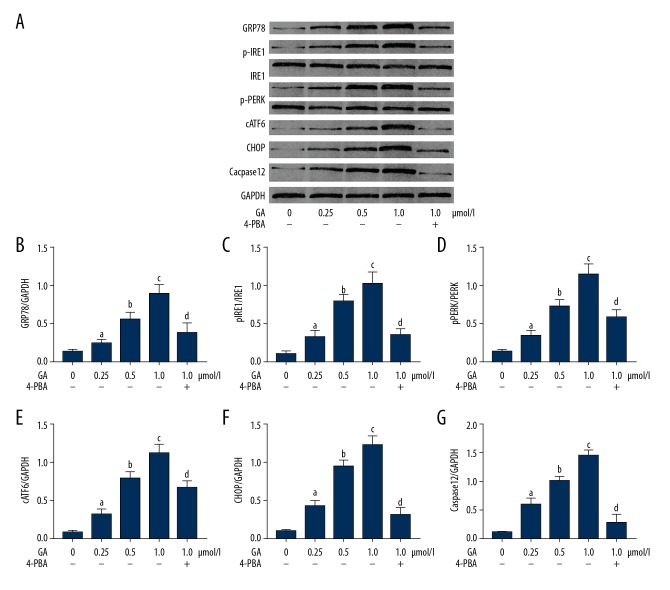
Figure 4.
(A) Bands indicate the immunoblots of GRP78, p-IRE1, IRE1, p-PERK, PERK, cATF6, CHOP, caspase12, and GAPDH in A549 cells incubated with gambogic acid (GA) at concentrations of 0, 0.25, 0.5, and 1.0 μmol/l, respectively. (B) Columns indicate the relative expression level of GRP78 (normalized to GAPDH) in A549 cells. (C) Columns indicate the phosphorylation level of IRE1 (p-IRE1/IRE1) in A549 cells. (D) Columns indicate the phosphorylation level of PERK (p-PERK/PERK) in A549 cells. (E) Columns indicate the relative expression level of cATF6 (normalized to GAPDH) in A549 cells. (F) Relative expression level of CHOP (normalized to GAPDH) in A549 cells. (G) Relative expression level of caspase12 (normalized to GAPDH) in A549 cells. [a Differences were statistically significant compared with control (p<0.05); b Differences were statistically significant compared with cells incubated with GA at 0.25 μmol/l; c Differences were statistically significant compared with cells incubated with GA at 0.5 μmol/l; d Differences were statistically significant compared with cells incubated with GA at 1.0 μmol/l].

