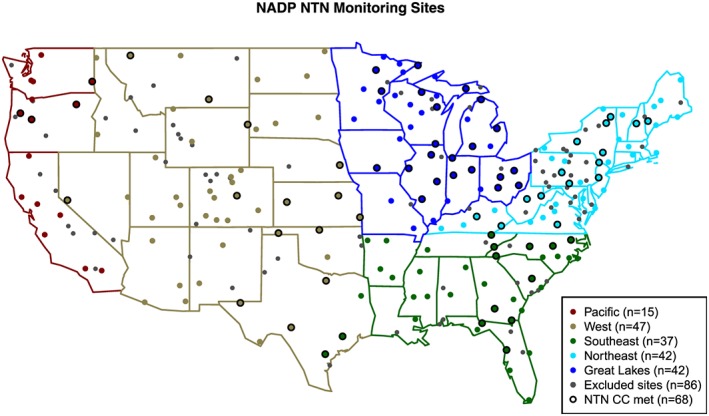
Figure 1.

Location of 183 NADP/NTN monitors used in the analysis. Color‐coded regions are used in Figure 4 and Figures S3, S4, and S7 provided in the supporting information. The black‐boarded colored circles (NTN CC met) indicate sites that met the full NADP/NTN completeness criteria for the entire 11‐year time series. NADP = National Atmospheric Deposition Program; NTN = National Trends Network; CC = completeness criteria.
