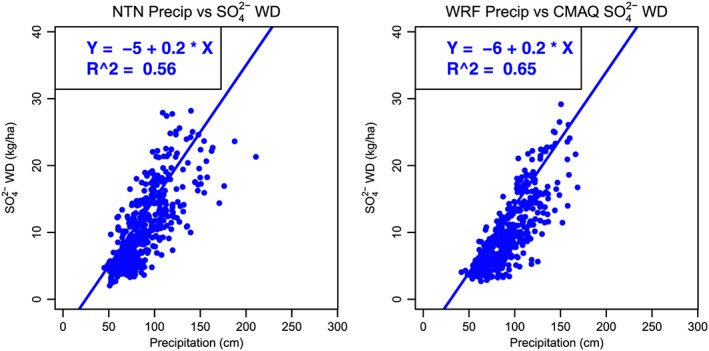
Figure 2.

Strength of linear relationship between annual accumulated precipitation and sulfate wet deposition at NTN sites in the Great Lakes subregion based on observed data (left) and modeled data (right). NTN = National Trends Network.

Strength of linear relationship between annual accumulated precipitation and sulfate wet deposition at NTN sites in the Great Lakes subregion based on observed data (left) and modeled data (right). NTN = National Trends Network.