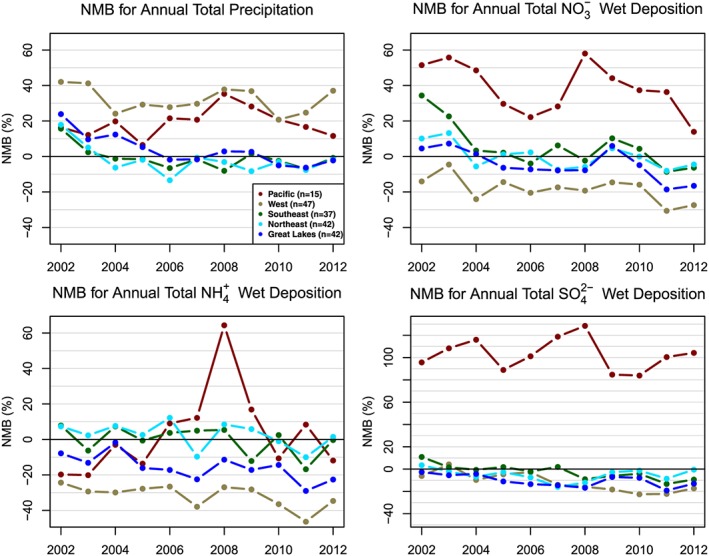
Figure 4.

Time series of normalized mean bias (NMB; %) of annual Weather Research and Forecasting precipitation and annual Community Multiscale Air Quality Model wet deposition for 2002 to 2012 based on model sums compared to National Atmospheric Deposition Program/National Trends Network observations. NMB values were calculated for each of the five subregions shown in Figure 1. NMB = normalized mean bias.
