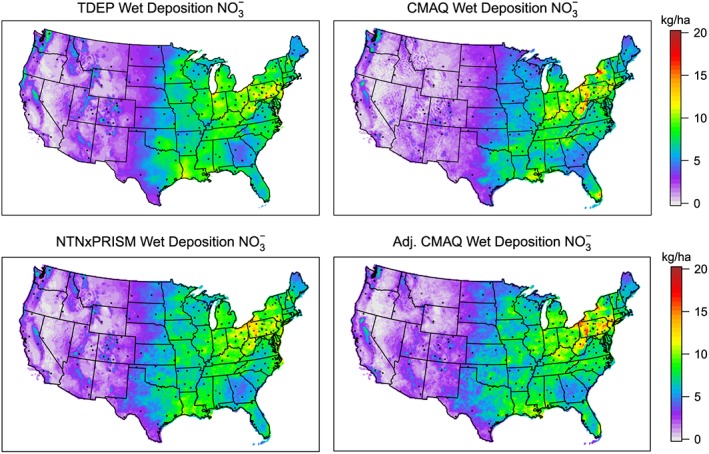
Figure 5.

Annual wet deposition of nitrate (kg/ha) in 2012 based on TDEP (top left), CMAQ (top right), NTN × PRISM (Method 4; bottom left) and precip‐adjusted and bias‐adjusted CMAQ (Method 2; bottom right). National Atmospheric Deposition Program/National Trends Network monitor locations with annual data for 2012 are shown on all the maps. Sites that were dropped from the trend analysis in section 3.4 because they did not have a sufficiently long time series of measurements are shown in gray. TDEP = NADP Total Deposition; CMAQ = Community Multiscale Air Quality Model; NTN = National Trends Network; PRISM = Parameter‐elevation Regressions on Independent Slopes Model.
