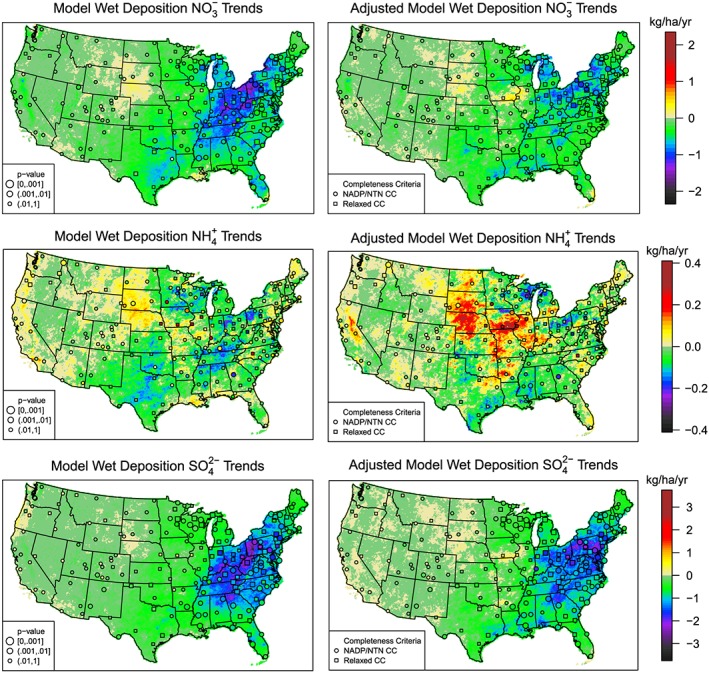
Figure 6.

Theil‐Sen trends (i.e., slopes) for the 2002–2012 time series of annual wet deposition at each NADP/NTN location and each model grid cell based on raw Community Multiscale Air Quality Model output (left column) and precip‐and bias‐adjusted Community Multiscale Air Quality Model output (right column) for wet deposition of nitrate (top row), ammonium (middle row) and sulfate (bottom row). Note the change in scale for ammonium. Trends at the NADP/NTN locations that met the full NADP/NTN completeness criteria are shown as colored circles with the remaining sites used in the analysis shown as colored squares. The size of the circle/square is based on the p‐value of a nonparametric Kendall rank test. A larger symbol indicates a statistically significant linear trend in the time series. NADP/NTN = National Atmospheric Deposition Program/National Trends Network; CC = completeness criteria.
