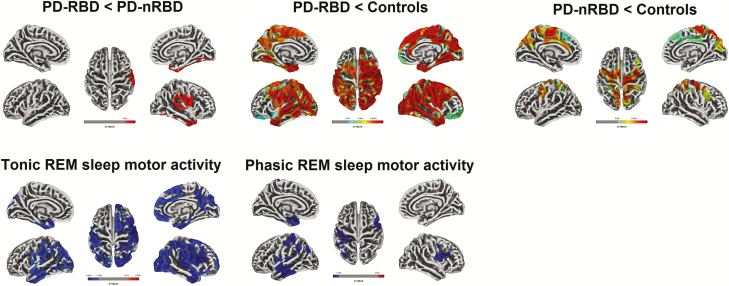
Figure 1.
Results of surface-based cortical thickness analysis. Cortical thickness in PD-RBD vs PD-nRBD (top left), PD-RBD vs controls (top center), and PD-nRBD vs controls (top right). Correlations between cortical thickness and percentage of tonic (bottom left) and phasic (bottom center) REM sleep motor activity in people with PD. Results are presented at p < 0.05 corrected for multiple comparisons (FWE-corrected), with age, gender, and education as covariates. UPDRS-III and MCI status were included as covariates for comparisons between PD-RBD and PD-nRBD subgroups and for correlation analyses. The color bars indicate the p-values for between-group differences in cortical thickness, with red-yellow areas representing significant thinning in the first compared to the second group (top line) and blue gradient representing significant negative correlation between cortical thickness and tonic and phasic REM sleep motor activity (bottom line). FWE = family-wise error; MCI = mild cognitive impairment; PD-RBD = Parkinson’s disease with REM sleep behavior disorder; PD-nRBD = PD without RBD; UPDRS-III = Unified Parkinson’s Disease Rating Scale, Part III.

