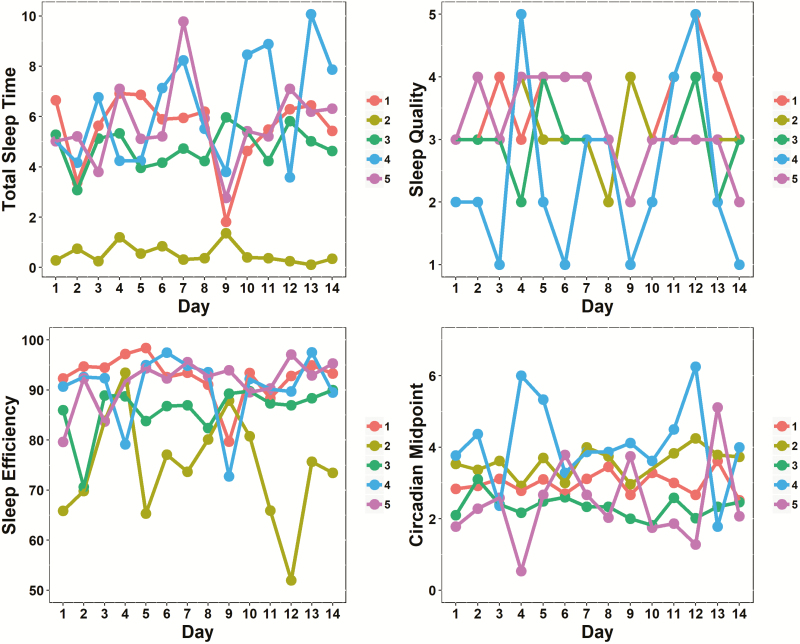
Figure 2.
Spaghetti plots of total sleep time (in hours; top left), sleep efficiency (%; bottom left), sleep quality ratings (1 = very poor, 5 = excellent; top right), and circadian midpoint values (numeric time; bottom right) for five sample participants across 14 days. Each color represents a different participant.

