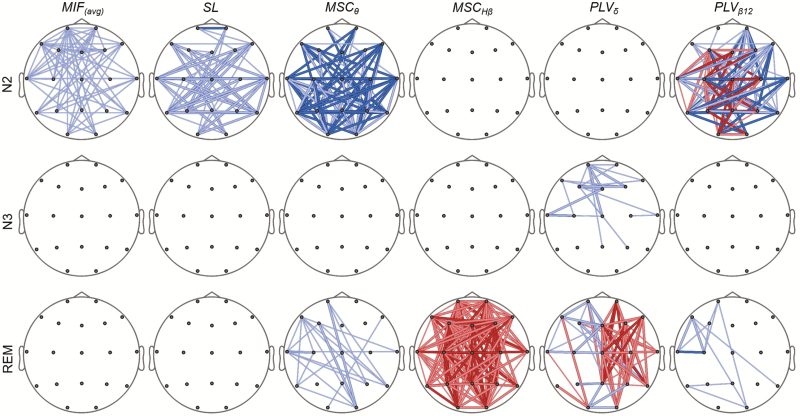
Figure 4.
SPM showing statistical connectivity alterations after FDR correction in sleep stages N2, N3, and REM between the first and the last NREM-REM cycles. Only first and last sleep cycles located at the first and last thirds of the night were considered (n = 27 for N2 and REM, and n = 17 for N3). For more details on line meanings, see the legend of Figure 3.

