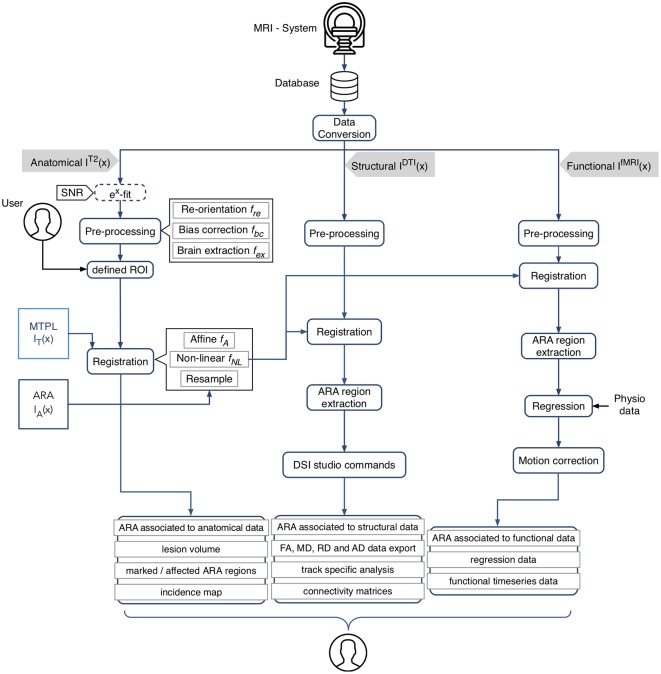
Figure 1.
Schematic overview of AIDAmri processing modules and subsequent computational steps for anatomical data (T2-weighted and T2 map), structural (diffusion tensor imaging, DTI) and functional data (resting-state functional magnetic resonance imaging, rs-fMRI). The given image function I(x) represents the 3D MRI image space and describes all intensities at the position . All data types are pre-processed using a re-orientation fre(x), bias correction fbc(x) and brain extraction fex(x). The user has the opportunity to define individual regions of interest (ROIs), e.g., a lesion mask, to compare particular areas over different measurements by generating an incidence map. The combined transformation f of the affine fA and non-linear transformation fNL is applied to MRI template MTPL IT(x) and subsequently the ARA IA(x) with the pre-processed data set IT2(x). DTI IDTI(x) and rs-fMRI IfMRI(x) processing steps were implemented based on established protocols (Budde and Song, 2010; Kim et al., 2012; Gorges et al., 2017). AIDAmri generates a variety of outputs such as the connectivity matrices which can be used for further atlas-based connectivity analysis. Icons designed by Smashicons from www.flaticon.com.

