
Figure 1.
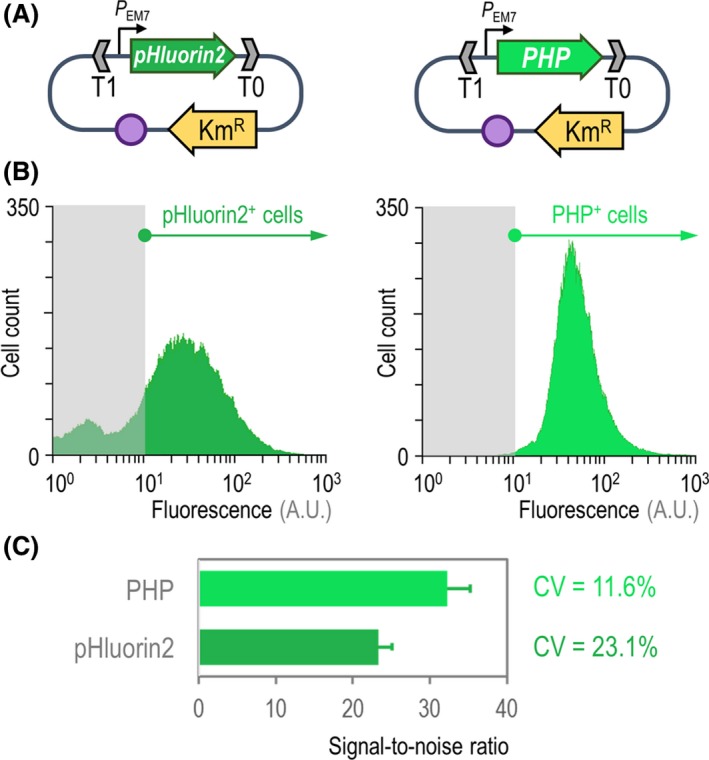
Benchmarking of the PHP indicator for the assessment of intracellular pH.
A. Two separate expression plasmids were constructed for the calibrated expression of the synthetic genes encoding the pHluorin2 or PHP indicators. In both cases, the expression of the genes is driven by the constitutive PEM 7 promoter, and the backbone used for these constructs (vector pSEVA2513) carries the oriV(RSF1010) origin of replication, indicated in the scheme as a purple circle. The kanamycin‐resistance (KmR) determinant and the T1 and T0 transcriptional terminators are likewise highlighted in the plasmid maps.
B. Flow cytometry exploration of the pHluorin2 and PHP indicators. Plasmid pS2513·pHluorin2 or pS2513·PHP was transformed in P. putida KT2440, and the cells were grown in LB medium until the mid‐exponential phase of growth. Cells were processed as indicated in Experimental Procedures , and the histograms show the distribution of fluorescence (in arbitrary units, A.U.) stemming from pHluorin2 or PHP (the bacterial populations positive for the indicators are indicated in each case). The light grey rectangle in each plot identifies the region considered negative for the fluorescence signal, which was assessed with P. putida carrying the empty pSEVA2513 vector and grown under the same conditions.
C. Key performance parameters of the pH indicators. The signal‐to‐noise ratio was calculated from flow cytometry measurements of P. putida KT2440 carrying either plasmid pS2513·pHluorin2 or pS2513·PHP as indicated above. The bars represent the signal‐to‐noise ratio for each sensor and the 95% confidence interval calculated from four independent experiments. The coefficient of variation (CV) of the fluorescence signal was also calculated from these measurements.