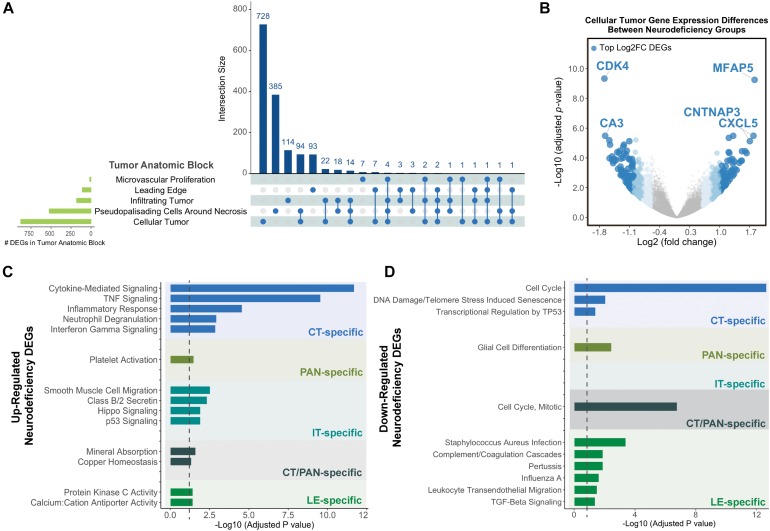
FIGURE 2.
Differential gene expression results for neurodeficiency. (A) UpSet diagram showing the intersection size of differentially expressed genes (DEGs; with an FDR-adjusted p-value <= 0.05 and |fold change| >= 1.5 cutoff) across tumor anatomic blocks. (B) Volcano plot displaying DEGs in the Cellular Tumor (CT) tumor anatomic block and highlighting top fold change (FC) genes. Genes colors are indicated using a quartile-based segmented color scale: not significantly differentially expressed (|fold change| < 1.5); 1.5 ≤ |fold change| < 1.75; 1.75 ≤ |fold change| < 2.0; and |fold change| ≥ 2.0. (C) Significantly enriched gene ontology terms and pathways for upregulated tumor anatomic block DEGs, generating using Enrichr. Bar plots indicate statistical significances (adjusted p-value). (D) Significantly enriched gene ontology terms and pathways for downregulated tumor anatomic block DEGs, generating using Enrichr. Bar plots indicate statistical significances (adjusted p-value).

