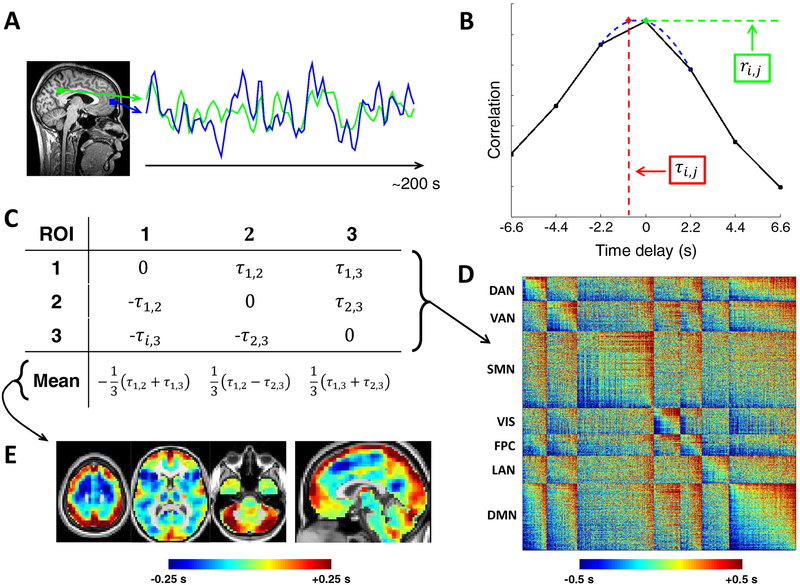
Figure 1. Computation and visualization of time delays from cross-covariance functions.
(A) Two exemplar ROI time series from the default mode network over ~200 s. (B) The corresponding CCF (Eq. (4)) is computed here over ± 6.6 s, which is equivalent to ± 3 frames as the repetition time was 2.2 s. The time delay (TD; τi,j) between these time series is the value at which the absolute value of the CCF is maximal. TD can be determined at a resolution finer than the temporal sampling density by parabolic interpolation (red) through the empirical extremum and the points on either side of it (blue) (Eq. (7)). Zero-lag correlation (FC; ri,j) is computed from the normalized CCF at zero-lag. (C) Toy case illustration of a TD matrix (Eq. (8)) comprising 3 voxels. TD matrices contain time delays between every pair of analyzed ROls and are anti symmetric by definition. Computing the mean over each column of a TD matrix generates a lag projection map (Eq. (9)), a one-dimensional projection of lag structure (D) TD matrix from real rsfMRI data (MSC group average). The rows and columns of this matrix have been sorted from early-to-late and by functional network affiliation. Doing so reveals a range of delays on the order of 1 s both within (on-diagonal) and between (off-diagonal) networks. See text for description of ROls. (E) Example lag projection map computed from the full MSC average TD matrix. The projection identifies regions whose spontaneous activity on average tends to be early (blue) or late (red) with respect to ongoing activity in the rest of the brain (Mitra et al., 2014). DAN, dorsal attention network; VAN, ventral attention network; SMN, sensorimotor network; VIS, visual network; FPC, frontoparietal control network; LAN, language network; DMN, default mode network.

