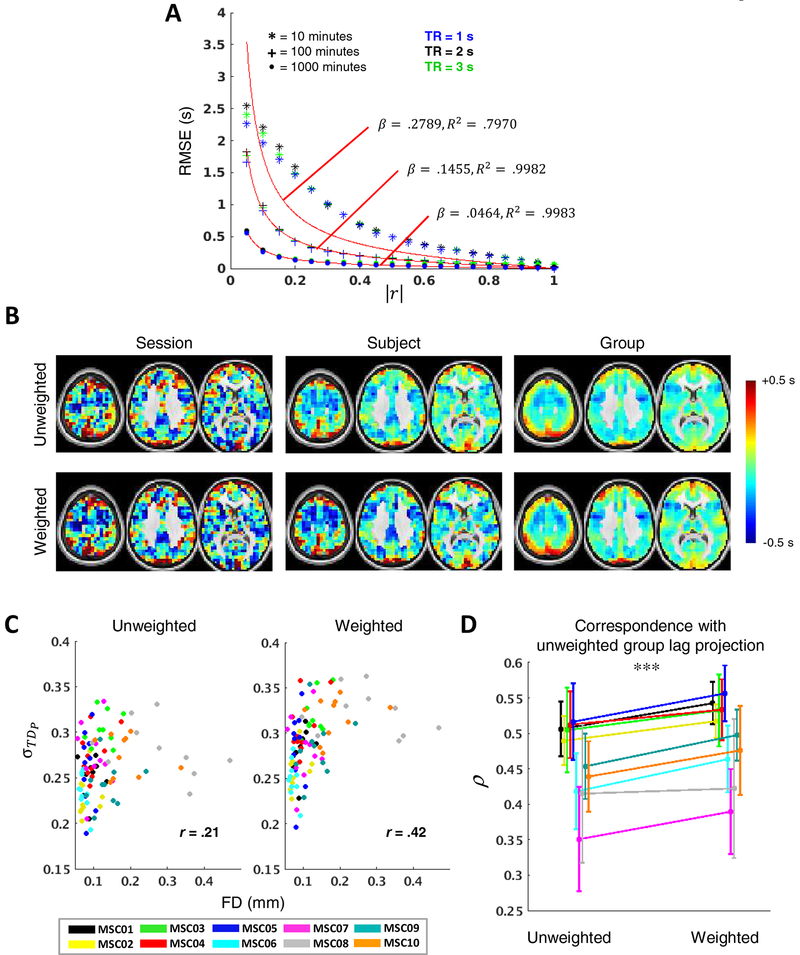
Figure 10. |FC|-weighted lag projections improve reliability.
(A) Modeling the relationship between TDE error and zero-lag correlation magnitude. By adjusting a single parameter, β, Eq.(15) (red) captures this relationship well for a range of data quantities and TRs. For each data quantity, β and R2 values are based on fit to 2 s TR. (B) Example unweighted (top) and weighted (bottom) lag projections for MSC01 session 1 (left), MSC01 (middle; TD averaged over all 10 sessions prior to lag projection computation), and MSC01–10 (right; TD first averaged over all 100 sessions). (C) σ:FD plots depicting the width of the distributions of lag projection values for each MSC session as a function of mean FD. Weighting increases distribution widths as well as the relationship between distribution width and data loss. (D) Correspondence of session-level unweighted and weighted lag projections with group unweighted lag projection. Weighting strongly improves reliability. (***p < .001).

