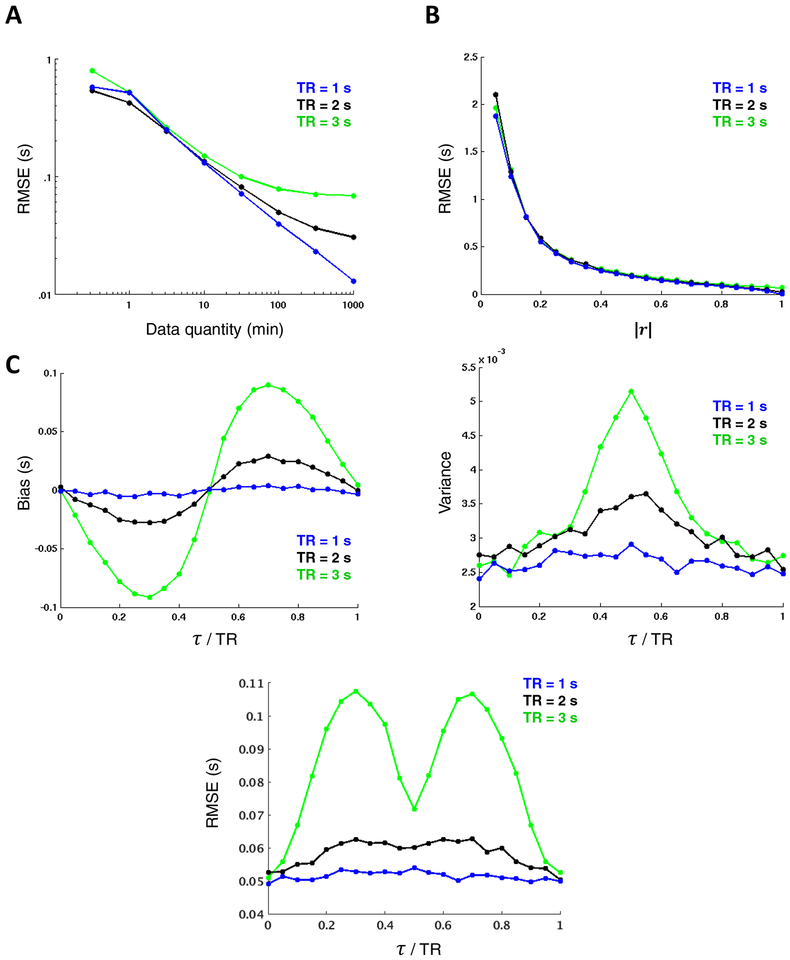
Figure 3. TDE dependence on data quantity, correlation magnitude, and temporal sampling interval.
Surrogate time series (τ = 0.5 s) reveal strong inverse relationships between TDE accuracy and both (A) data quantity (shown for r = 0.9 on a log-log plot spanning several decades) and (B) correlation magnitude (shown for 60 minutes of data). Note that longer TRs asymptote at higher RMSE, limiting their precision relative to shorter TRs. (C) TDE bias (left) reflects parabolic interpolation bias. values tend to cluster at ½ multiples of the TR. The variance pattern (right) is attributable to the subsample TDE that is required in fMRI analysis and thus peaks halfway between samples. Combining these two trends yields a pattern in which RMSE increases with increasing temporal distance between τ and the nearest TR multiple, save for a trough midway between samples owing to the lack of bias in this region. In all cases, lower TRs yield more favorable results; however, TDE dependence on TR is small relative to data quantity and correlation magnitude. Each data point in the Figure represents a mean across 2,000 simulations.

