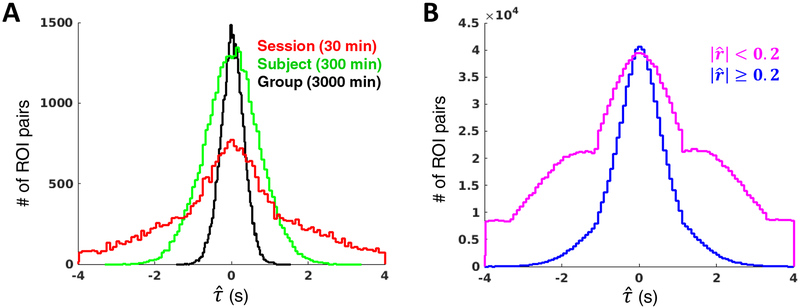
Figure 4. Manifestations of sampling error in real rsfMRI data without censoring.
(A) Distributions of pairwise time delays among 264 ROIs (upper triangular of TD matrix) at the session (red), subject (green) and group (black) levels in the MSC dataset Increasing data quantity reduces sampling error, as indicated by the width of the TD distributions. (B) Distributions of all MSC session-level pairwise time delays corresponding to zero-lag correlation magnitudes < .2 (pink) or ≥ .2 (blue), as determined by the MSC average correlation matrix. The increased width of the pink distribution results from sampling error associated with weaker correlations. The wide distribution also makes the bias of parabolic interpolation readily observable: time delay estimates cluster around the TR (here, 2.2 s) and slope discontinuities appear at every ½ TR.

