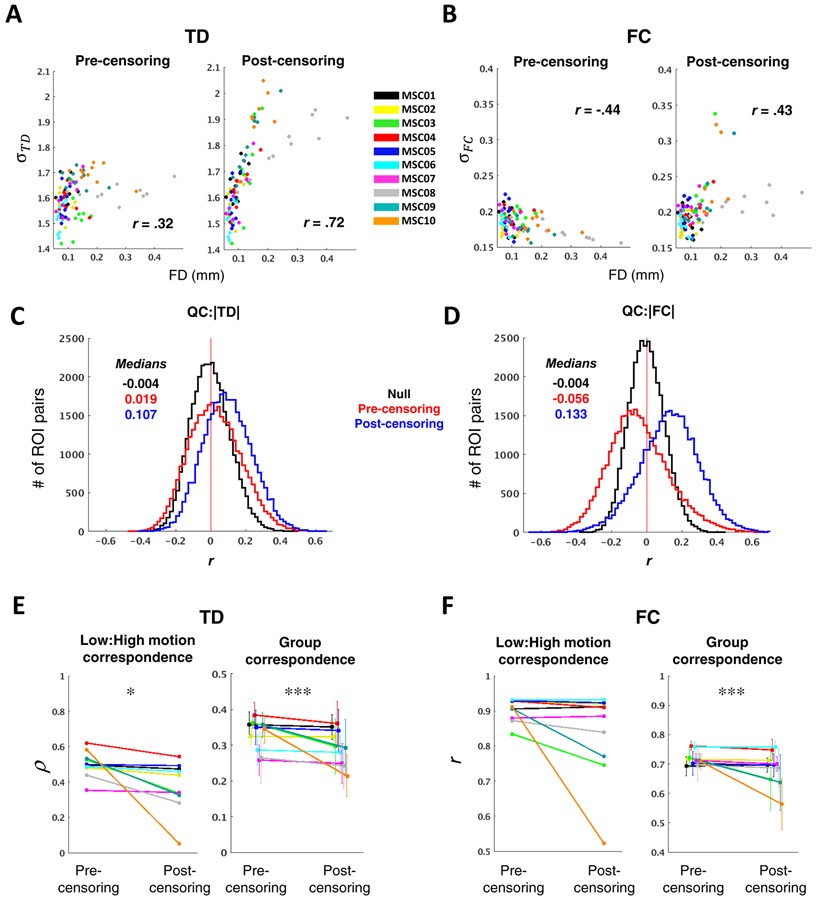
Figure 6. Sampling error arising from aggressive data exclusion.
(A) Scatter plots illustrating the relationship between TD distribution width, as measured by the standard deviation (σTD), and head motion/data loss, as measured by mean FD. Each point represents one MSC session, color-coded by subject. Pre-censoring plots reflect a relationship with head motion, while post-censoring plots predominantly reflect sampling error. Censoring exacerbates an already positive relationship between mean FD and σTD. (B) Same as in (A), but for FC. Following censoring, the relationship between σFC and mean FD changes from significantly negative to significantly positive. (C) Distribution of correlations between |TD| and mean FD, across all 100 sessions. Each data point included in the QC:|TD| histogram corresponds to a single ROI pair. Null distributions, computed by randomly permuting mean FD values, are centered near zero (black). Higher motion sessions show modestly greater magnitude time delays (left) before censoring (red); this effect is exacerbated after data exclusion (blue) due to increased sampling error in higher-motion sessions. (D) Same as in (C), but for |FC|. Censoring leads to inflated |FC| (blue). (E) The left panel shows intra-subject correspondence (Spearman’s rho) of the vectorized TD matrix averaged across the five lowest- and highest-motion sessions for each subject. The right panel shows, for each subject, mean correspondence between each session’s TD matrix and the censored group average. Error bars denote standard deviation. (F) Same as in (E), but for FC, and correspondence is measured as Pearson’s r. In both (D) and (E), stringent motion criteria adversely impact reliability (*p <.05; **p < .01; ***p < .001; N = 10 for Low:High motion correspondence, N = 100 for Group correspondence).

