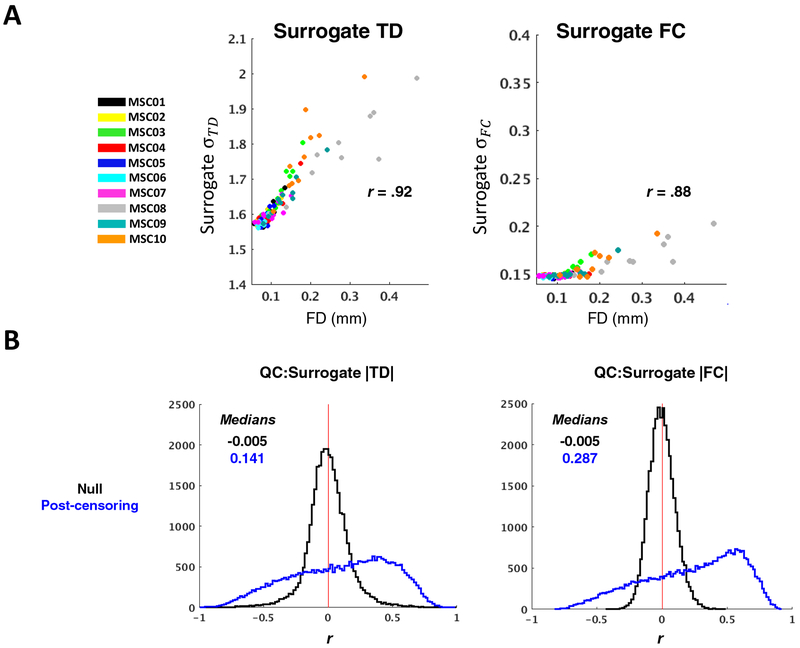
Figure 9. Censoring-induced sampling error in TD and FC computed from surrogate data remains substantial with minimum allowable block duration.
(A) Post-censoring σ:FD scatter plots as in Figure 8A, but for TD and FC distributions computed from surrogate data. The 100 real, session-specific temporal censoring masks were applied to a single set of surrogate time series, which was constructed from the MSC average 264 × 264 FC matrix (no lags were built in). Note that the group average correlation distribution is narrower than that obtained from single sessions; thus σTD values are somewhat larger than in Figure 8A (more sampling error) and σFC values are generally smaller than in Figure 8A. (B) Same distributions as in Figure 8B, but for TD and FC computed from surrogated data as described above. Effects of censoring- induced sampling error are still present with minimum allowable block duration.

