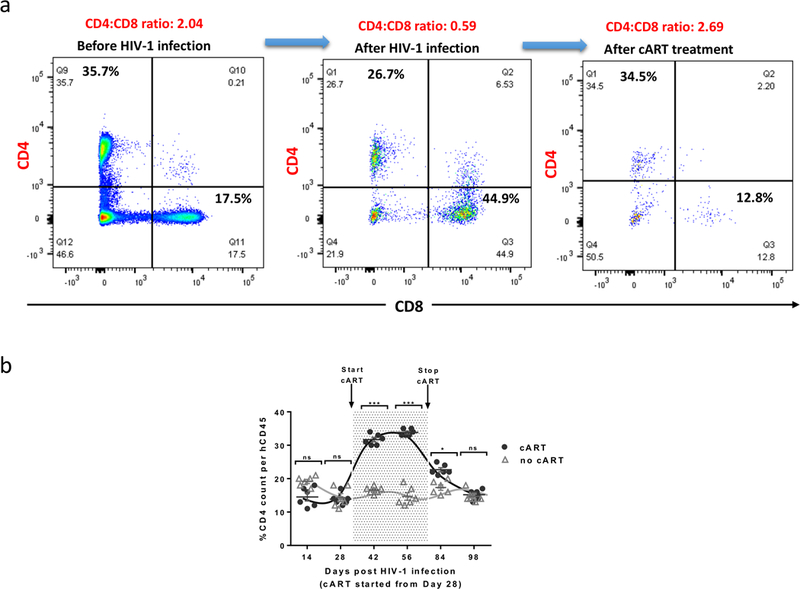
Figure 3. CD4+ cell count changes throughout the course of viral infection, cART and cART withdraw.

As infection progresses, the CD44:CD8 ratio decreases from 1.5–2.5 to >1.0, CD4:CD8 ratio has been served as a clinical parameter in evaluating HIV prognosis as well as treatment efficacies. a) Representative flow data indicating the change in CD4:CD8 ratios during the experimental course; b) Comparison trend chart indicating the effectiveness of cART, which can be identified as restored percentage of CD4+ T cells. Detection of CD4+ T cell count by flow cytometry. N: number of tested mice = 6; Error bars: means ± SEM. * p <0.05, ** p <0.01, ***p <0.001, **** p <0.0001, ns: no significant different. Two-way ANOVA analysis is employed. Figure is reprinted with permission22.
