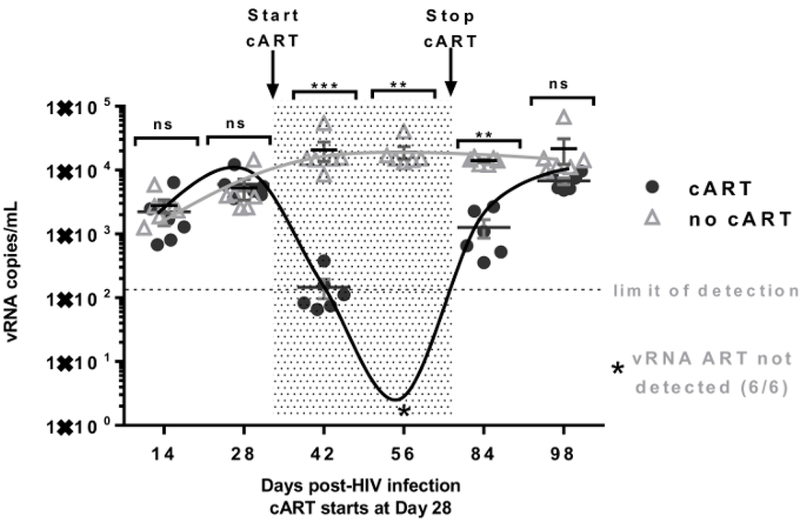
Figure 4. Changes of serum viral RNA copy numbers throughout the course of viral infection, cART and cART withdraw.

Detection of plasma viremia in the HIV-infected hu-NSG mice by qRT-PCR. The shaded area indicates the time period during which the mice received cART (from Day 28 to Day 70 as shown). The limit of detection (indicated by the dashed line) of the PCR assay is (~110–160 RNA copies/mL) in 50 to 80 μL of plasma obtained through the tail vein. Star (*) indicates viral RNA not detected in cART treated animals at Day 56. Serum viral RNA copy number analyzed from peripheral blood samples serves as direct evidence concerning the degree of viral infection. It should be in the agreement with the CD4 flow analysis. N: number of tested mice = 6; Error bars: means ± SEM. * p <0.05, ** p <0.01, *** p <0.001, **** p <0.0001, ns: no significant different. Two-way ANOVA analysis is employed. Figure is reprinted with permission22.
