
Figure 1.
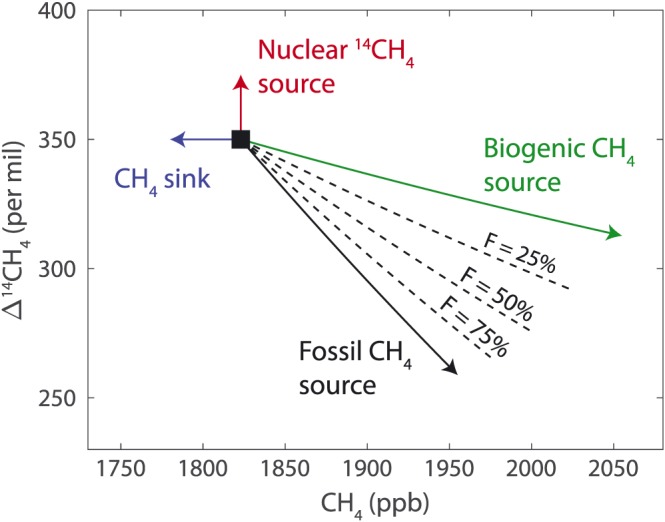
Diagram showing the expected change in CH4 concentration and change in Δ14CH4 from background values for different processes in 2014. Estimated global mean background composition in 2014 is shown with the black square. The dashed lines show the changes expected from mixed biogenic and fossil CH4 sources, with F denoting the fossil fraction of emissions.