
Figure 2.
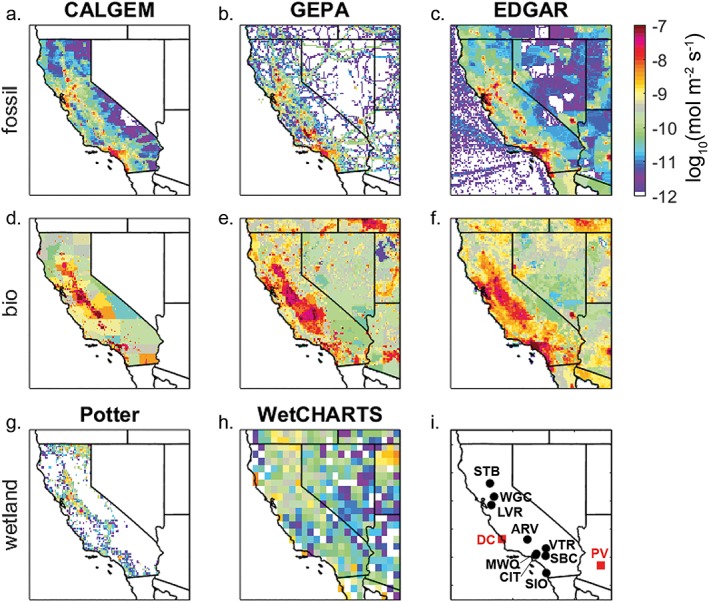
. Estimates of CH4 emissions from fossil sources (a–c), anthropogenic biogenic sources (d–f), and natural wetlands (g–h). In the top two rows, the estimates are from CALGEM (Jeong et al., 2012) in a and d, GEPA (Maasakkers et al., 2016) in b and e, and EDGAR (2011) in c and f. Wetland emissions from Potter et al. (2006) are shown in g and WetCHARTS (Bloom et al., 2017) in h. The locations of the observation sites and the two nuclear power plants Diablo Canyon (DC) and Palo Verde (PV) are shown in i. The color bar in the upper right applies to all panels a–h.