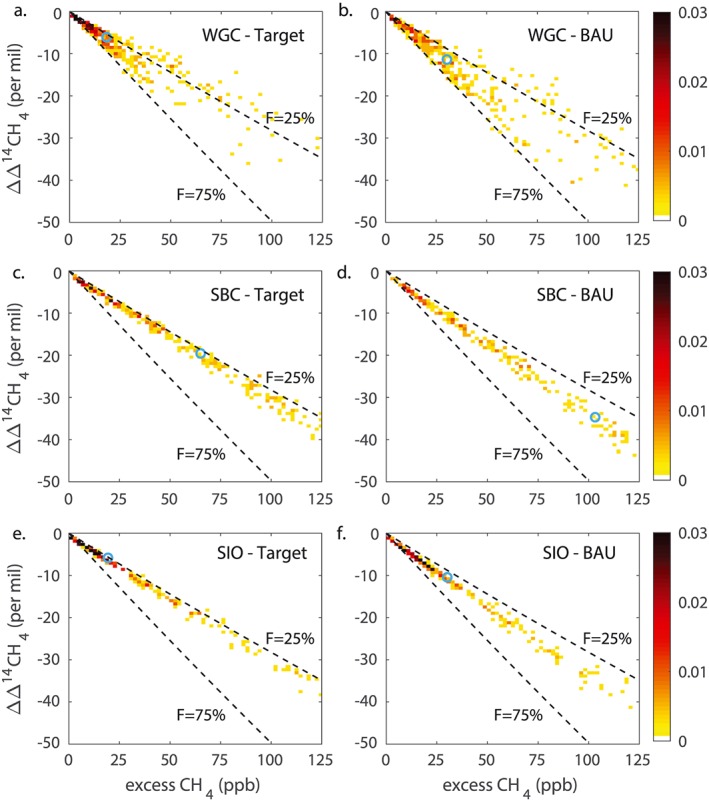
Figure 6.

Distributions of the simulated change in Δ14CH4 versus excess CH4 concentration, shown as two‐dimensional histograms at three selected sites, as in Figure 4. Here the simulations shown in the left column are for the Target scenario, and the right column for the BAU scenario. Other sites are shown in Figure S2.
