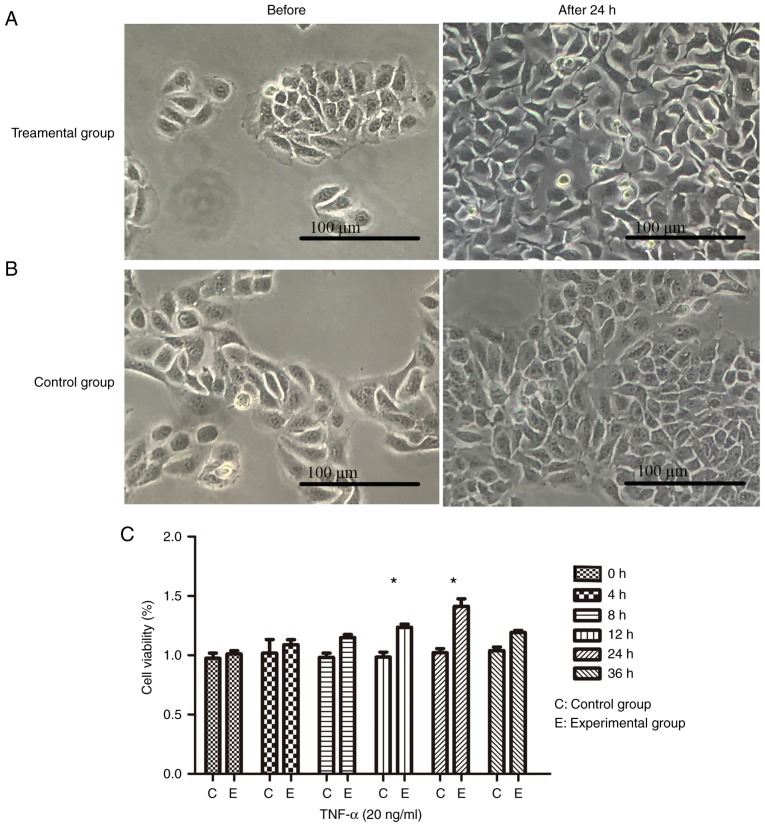
Figure 1.
TNF-α-stimulated HaCaT cells. (A) TNF-α was used to stimulate HaCaT cells for 24 h at a concentration of 20 ng/ml. Clearly irregular shapes, a large intercellular space and loose cells were observed, in addition to the increased levels of cell proliferation. (B) Cultured cells without any direct treatment. The cells were tightly connected, few in number and exhibited regular cell morphology when compared with cells stimulated with TNF-α. (C) Cell viability test. The calculated percentage of cell proliferation using optical density values revealed that the highest rate of cell proliferation was at 24 h. Data are presented as the mean ± standard deviation, n=3 per time point. *P<0.05 vs. the control group without TNF-α. TNF-α, tumor necrosis factor-α.

