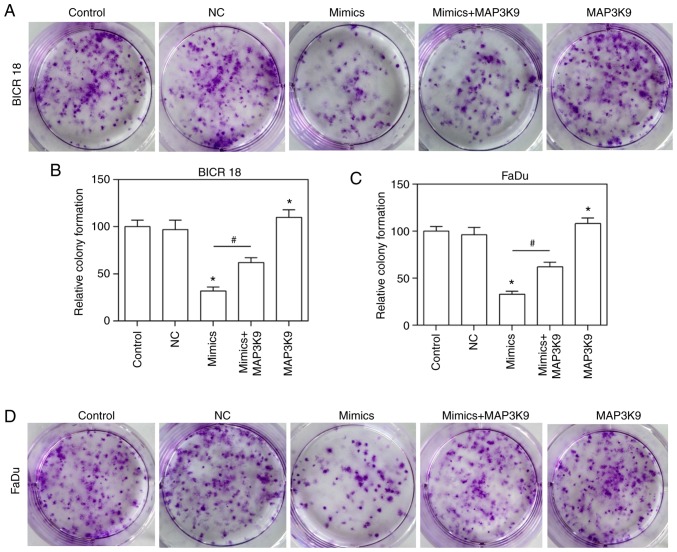
Figure 7.
Relative colony formation in the control, NC, miR-490-5p mimics, miR-490-5p mimics + MAP3K9 and MAP3K9 groups of BICR 18 and FaDu cells. (A) The images exhibited the stained colony in each group of BICR 18 cells. (B) Relative colony formation in each group of BICR 18 cells. (C) Relative colony formation in each group of FaDu cells. (D) The images demonstrated the stained colony in each group of FaDu cells. Bars indicates the mean ± standard deviation. *P<0.05 vs. NC groups; #P<0.05 vs. miR-490-5p mimics groups. miR, microRNA; NC, negative control; MAPK, mitogen activated protein kinase.

